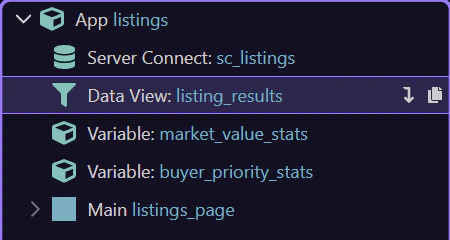
Server data first
`sc_listings` loads the catalog from the server.
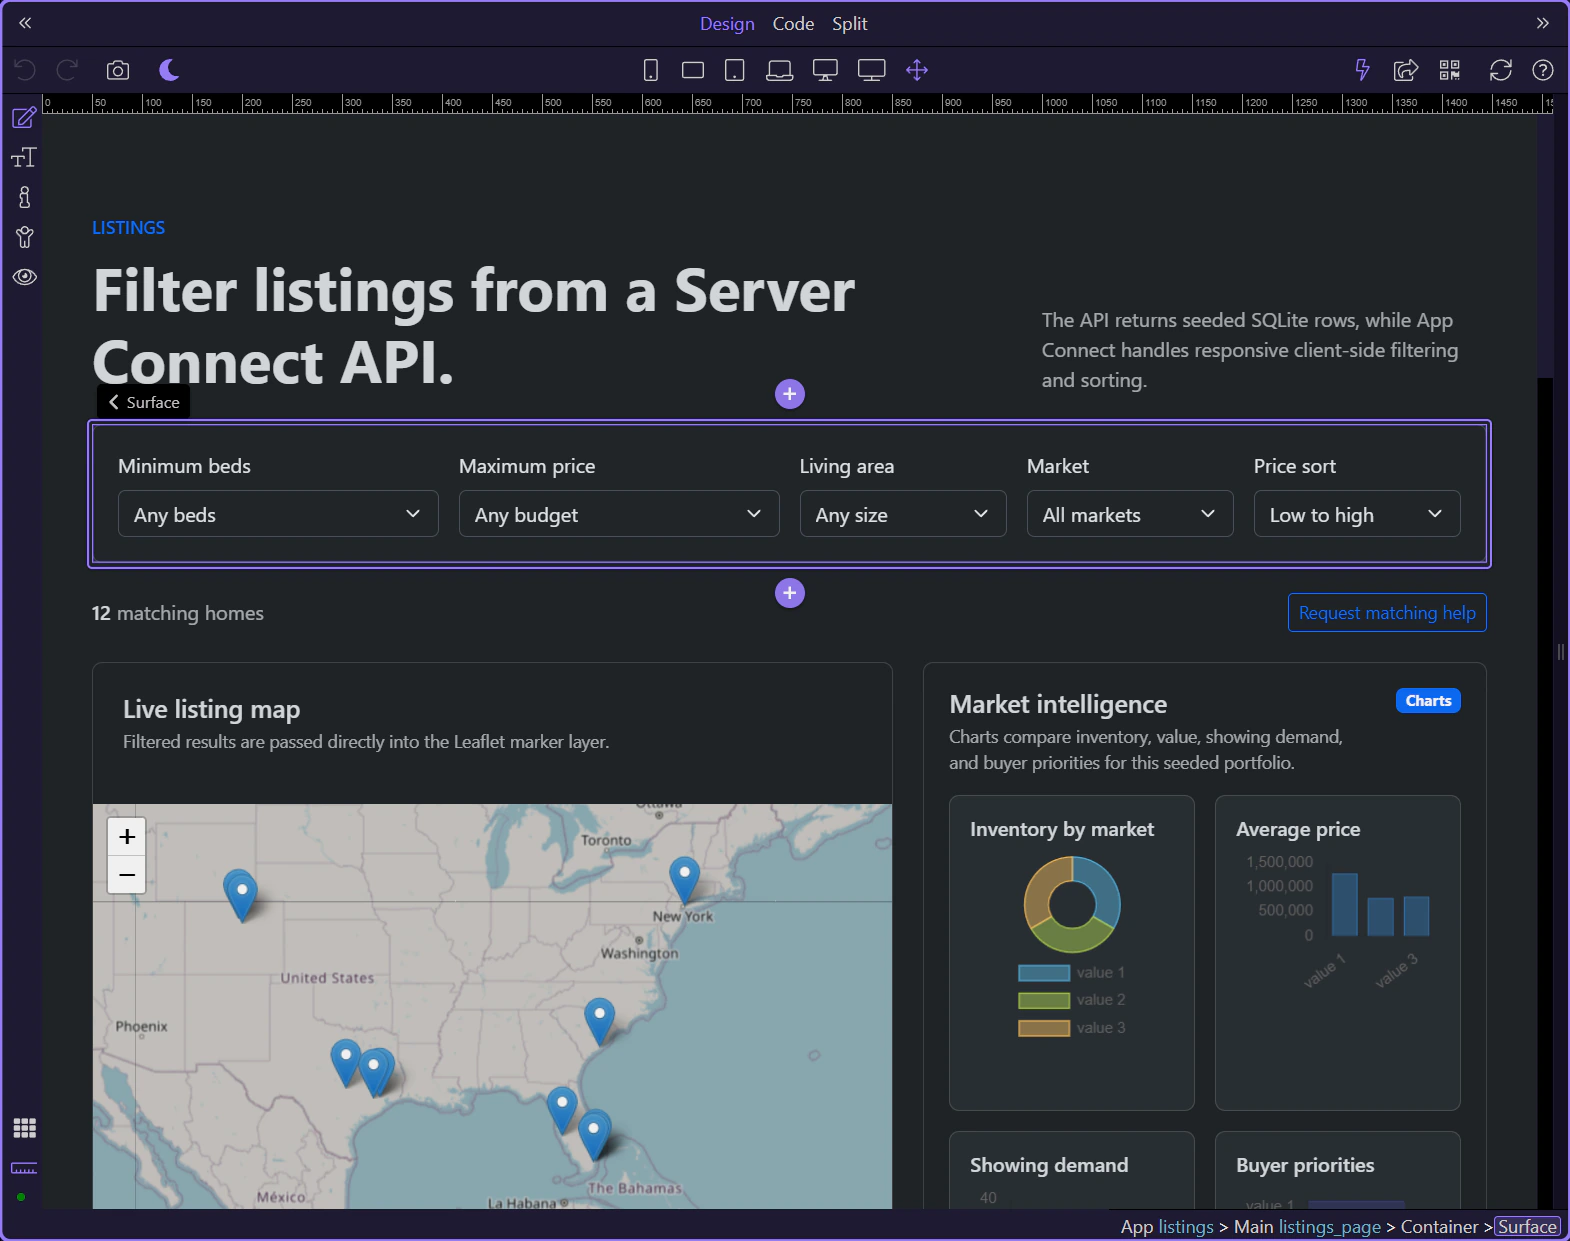
Focused walkthrough of the renewed Real Estate listings page: Server Connect source, Data View filters, synchronized map, charts, and repeated listing cards.
The listings page is the clearest App Connect page in the renewed demo. A Server Connect action loads the catalog, a Data View reshapes it, and several outputs stay synchronized from that one shaped collection.
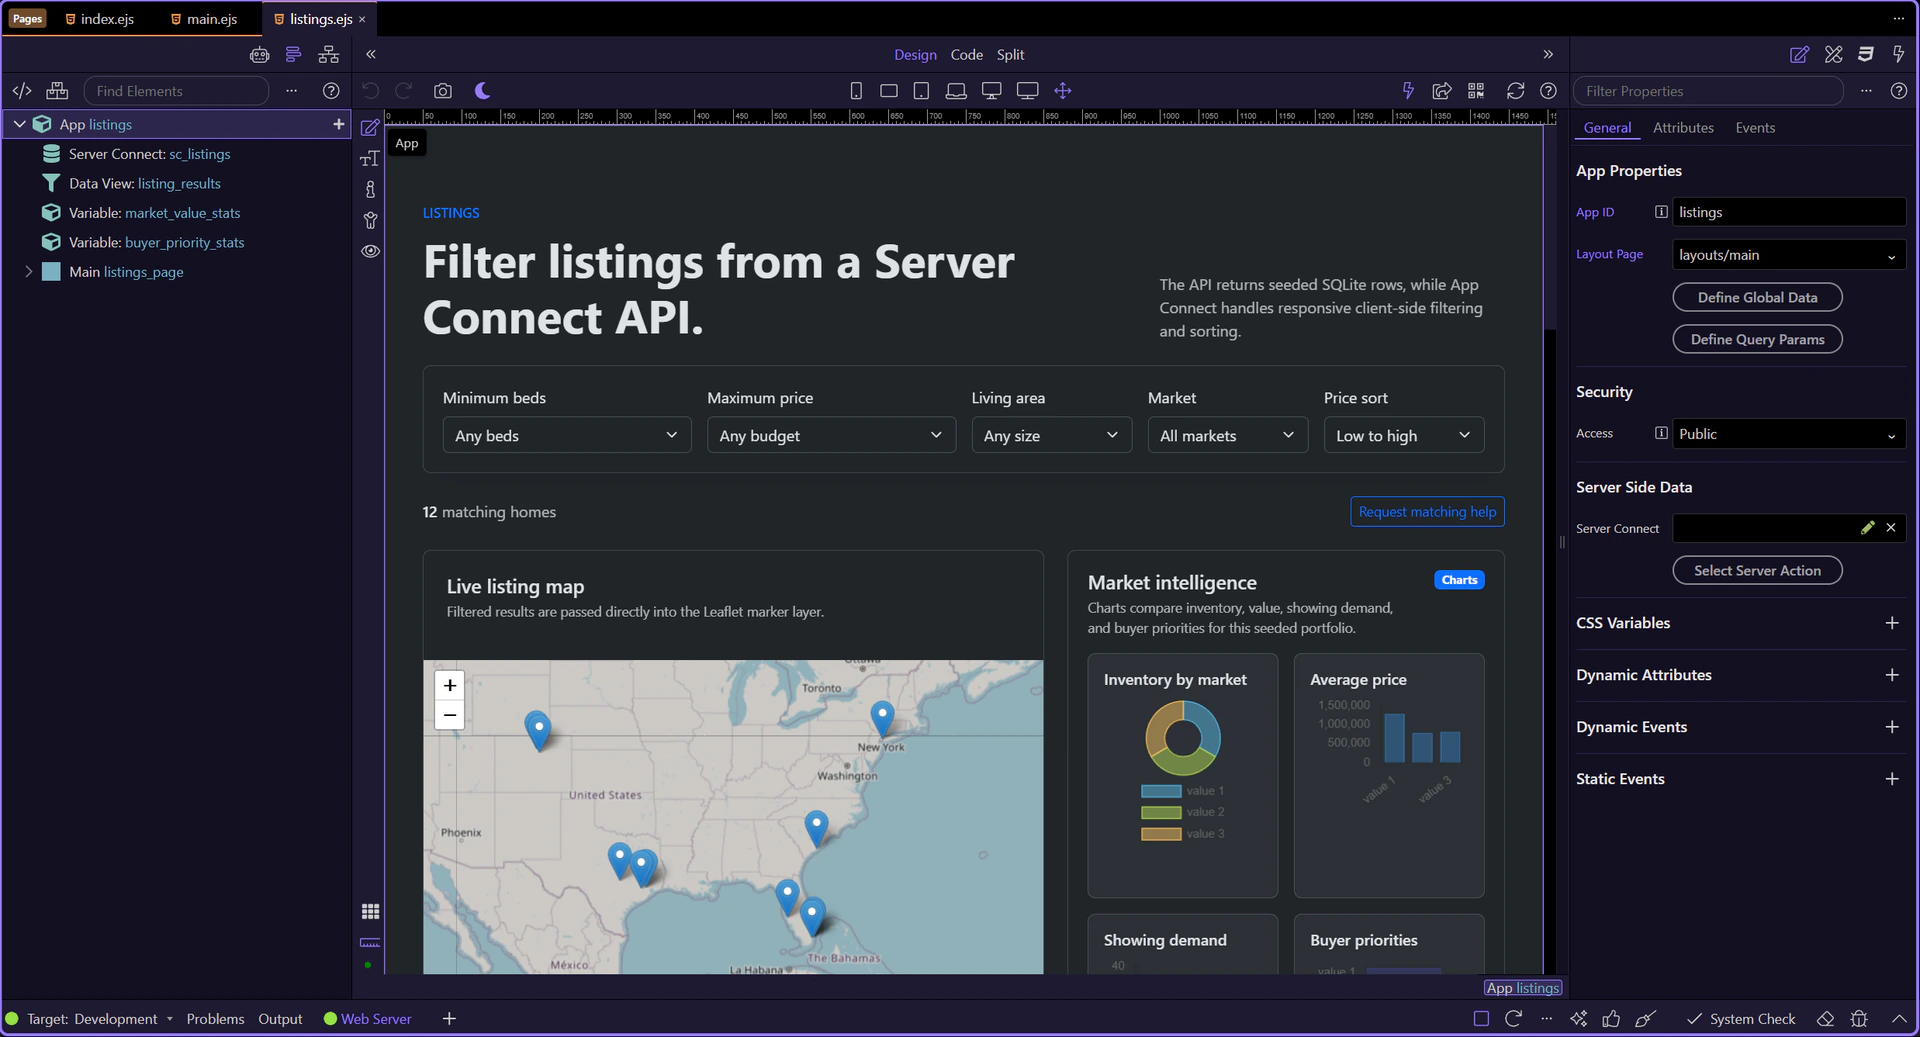
The listings walkthrough starts on views/listings.ejs, where the renewed demo shows the full filter pipeline on one page.

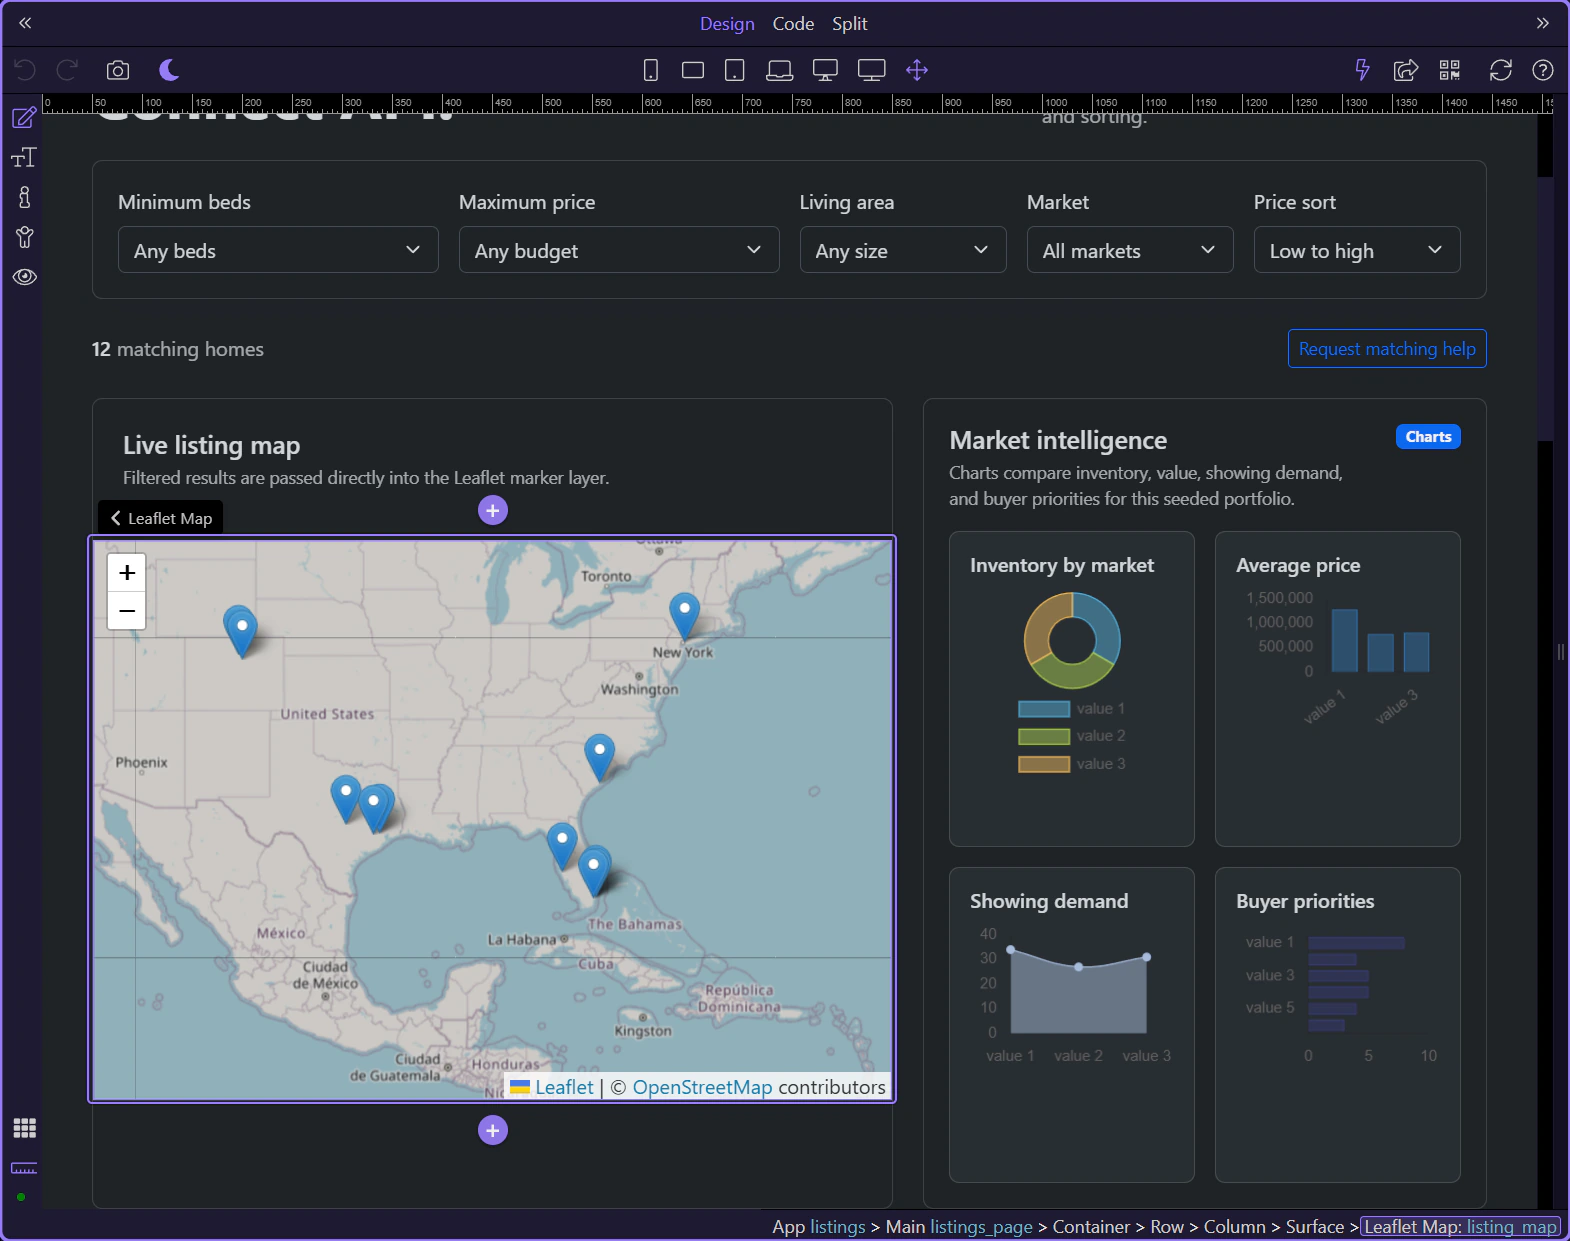
The listings page is now active in Design View, so the Structure and Properties panels can follow the live page context.
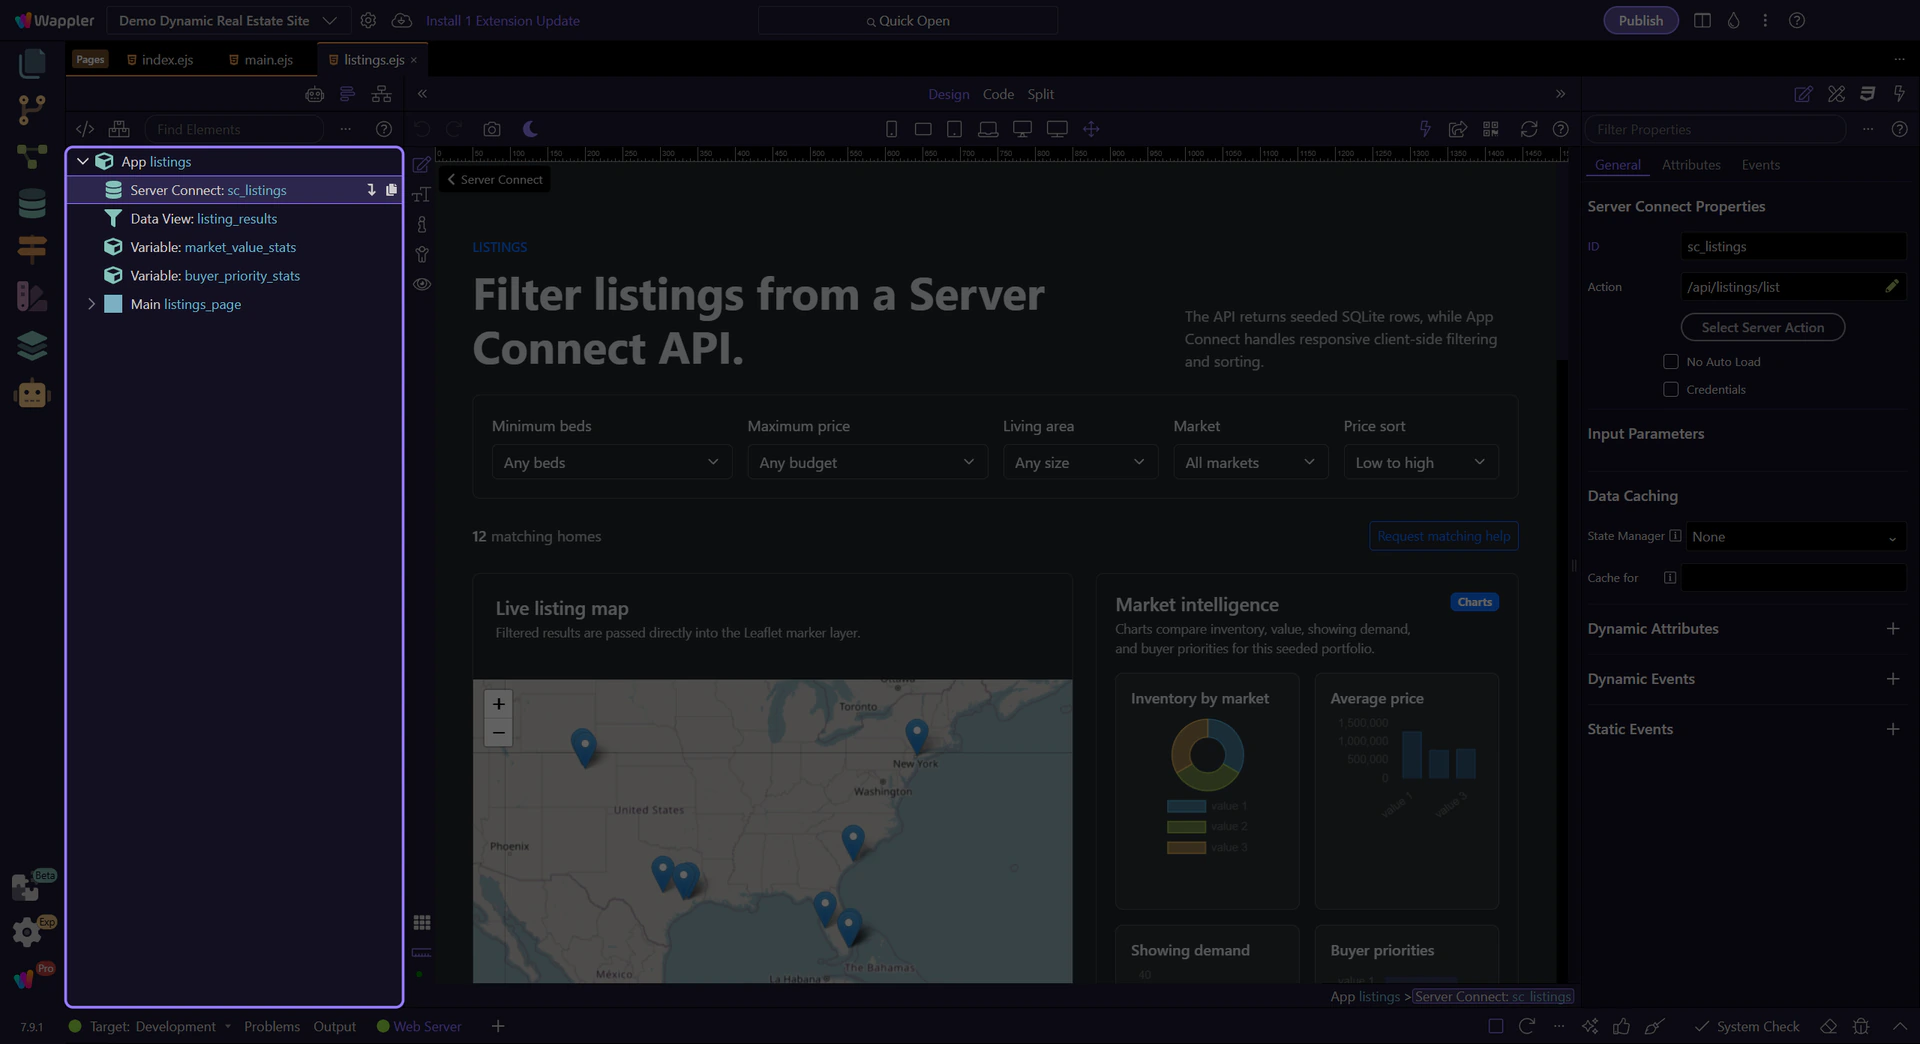
sc_listings calls /api/listings/list and exposes the raw collection for the page. Everything else on this screen builds on that server response.
listing_results is the shaping layer. It reads the API result, reacts to the input controls, and owns the current filtered and sorted result set.
This filter bar is where App Connect becomes practical for users: the controls are ordinary inputs, but their values feed the Data View expression directly.
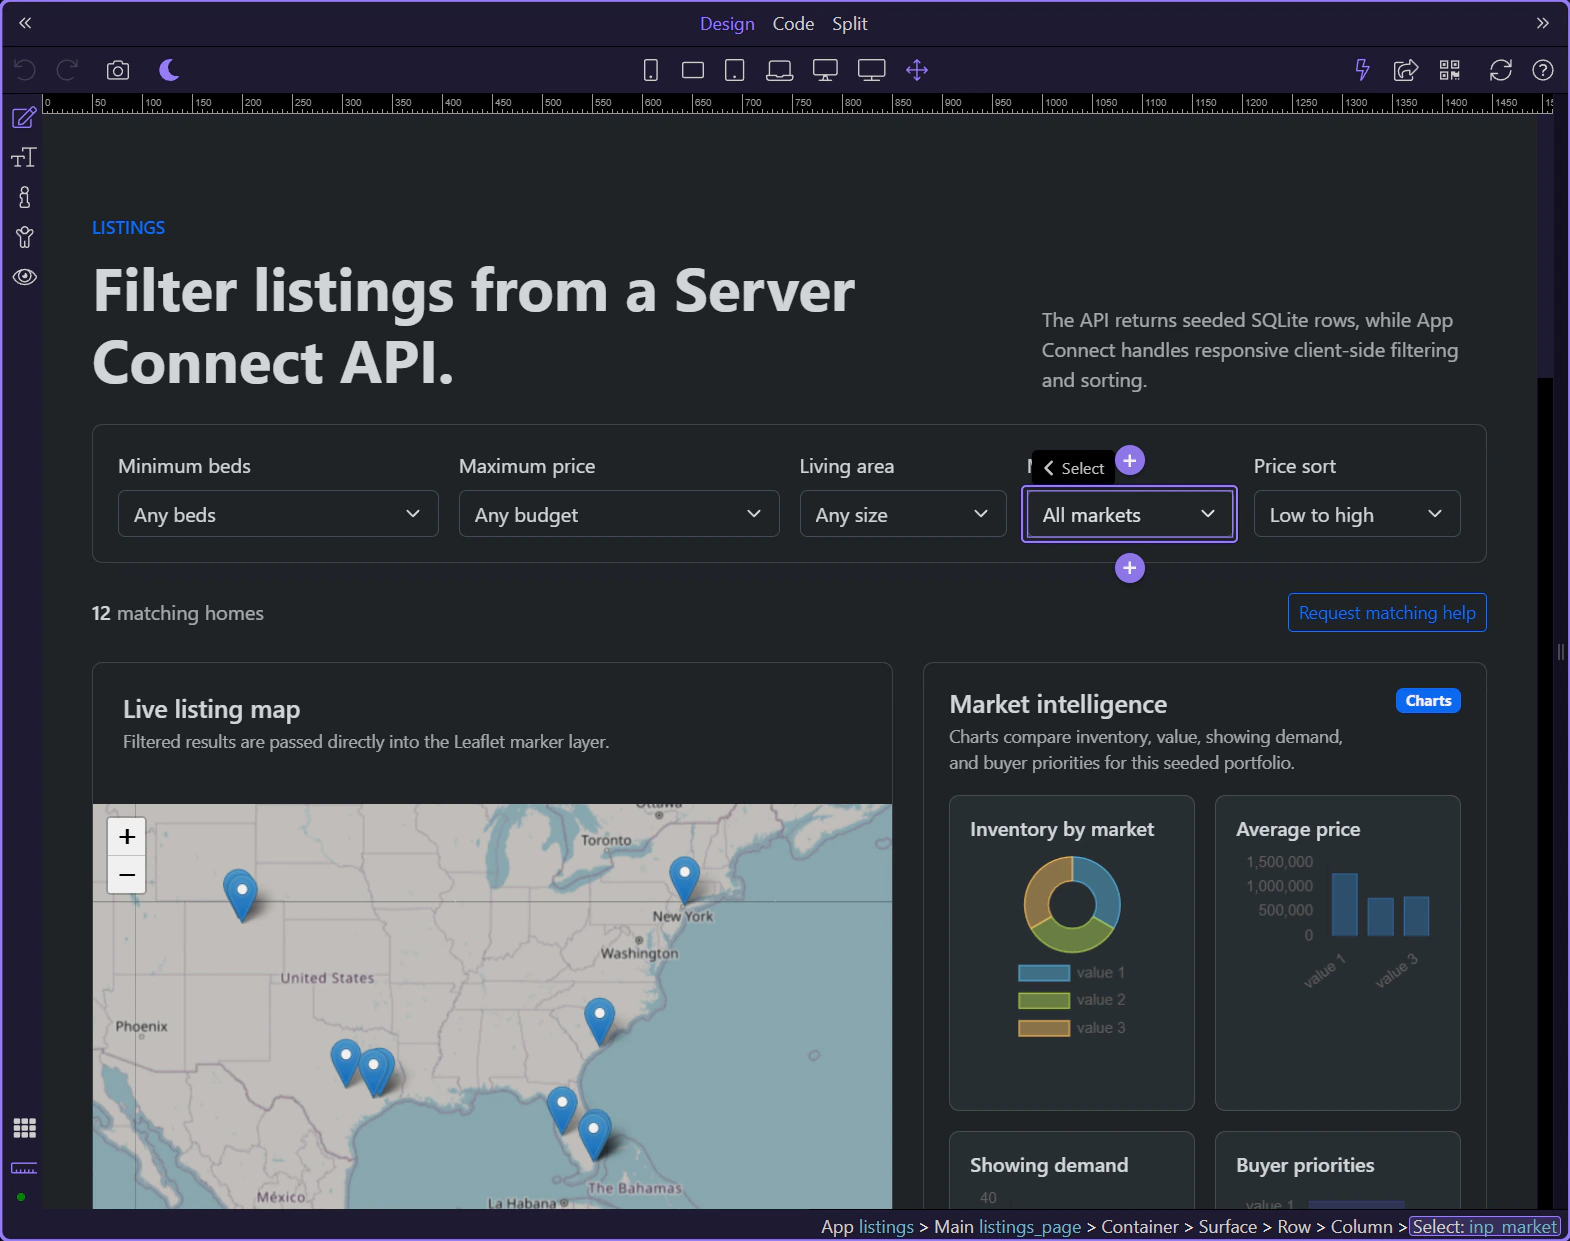
inp_market is one of the controls inside the Data View filter. It narrows the result set without another request because the filtered collection already lives on the page.
inp_sort_dir shows that the Data View also owns sorting. The page does not need separate card and map logic for sort order because both outputs read the same shaped collection.
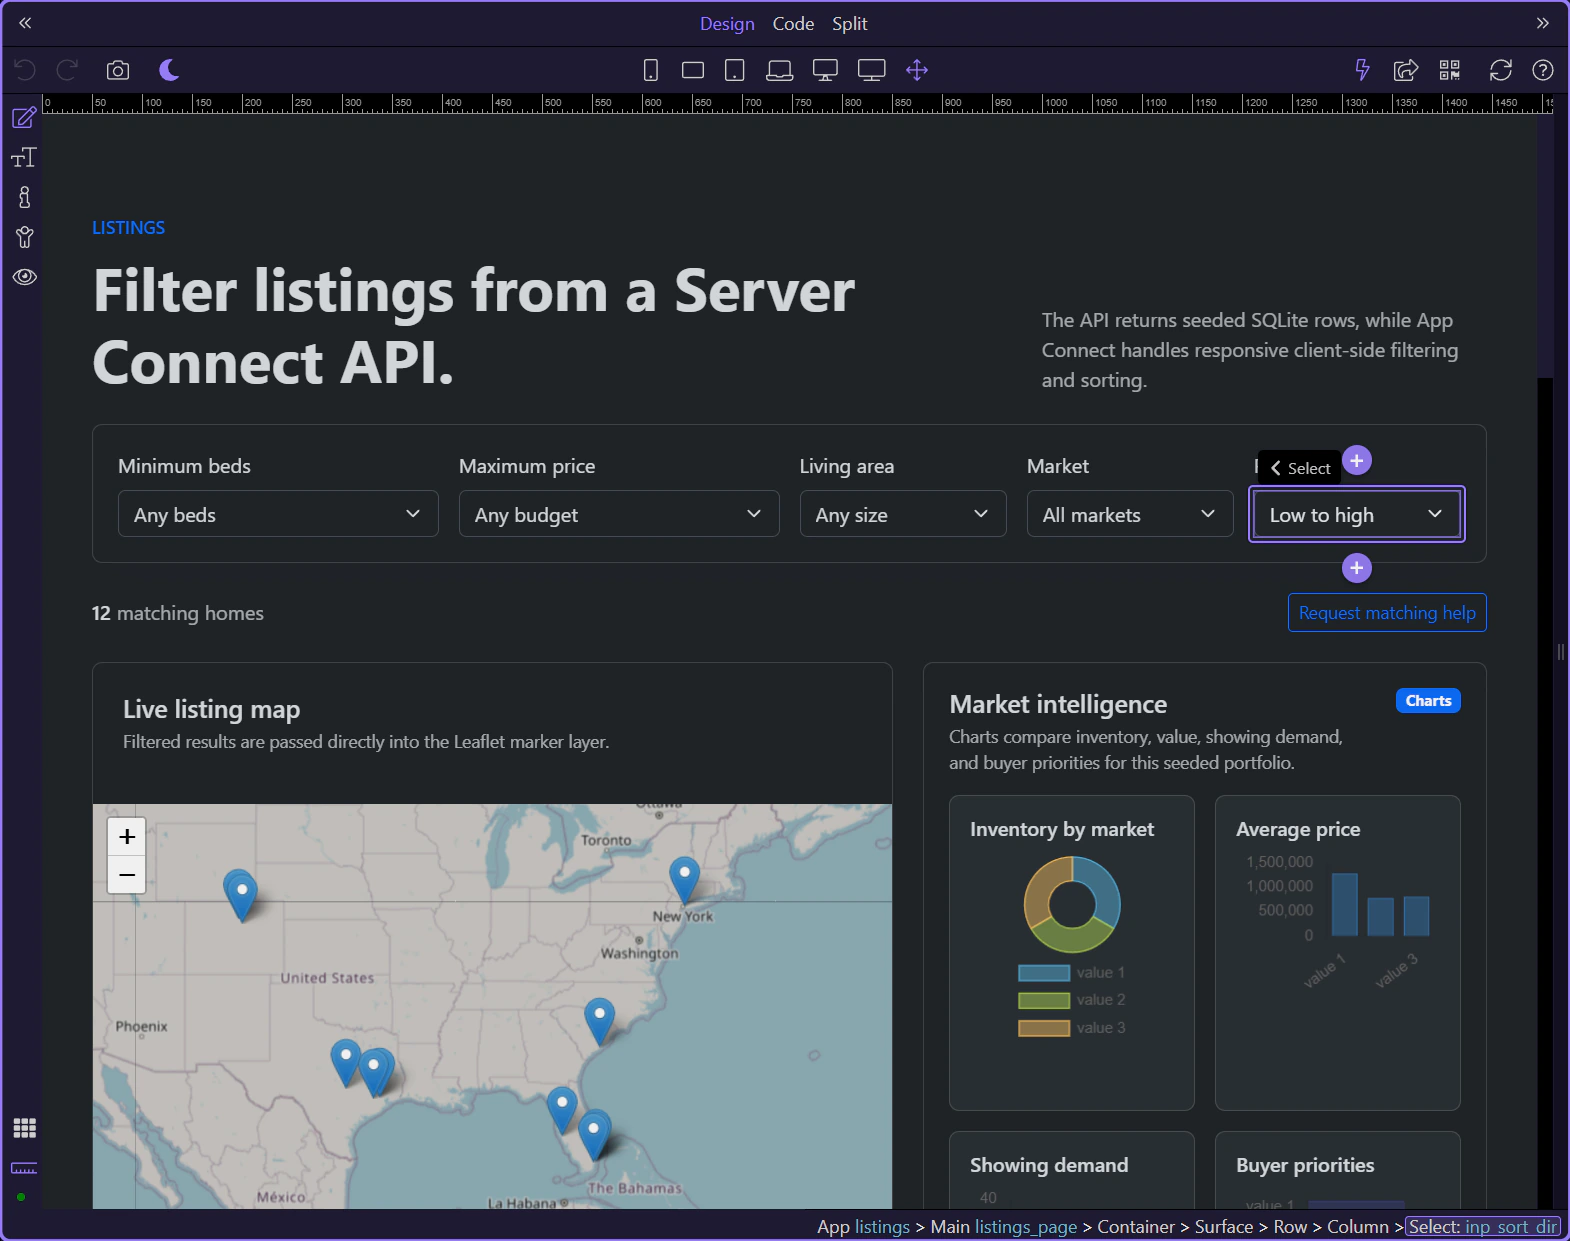
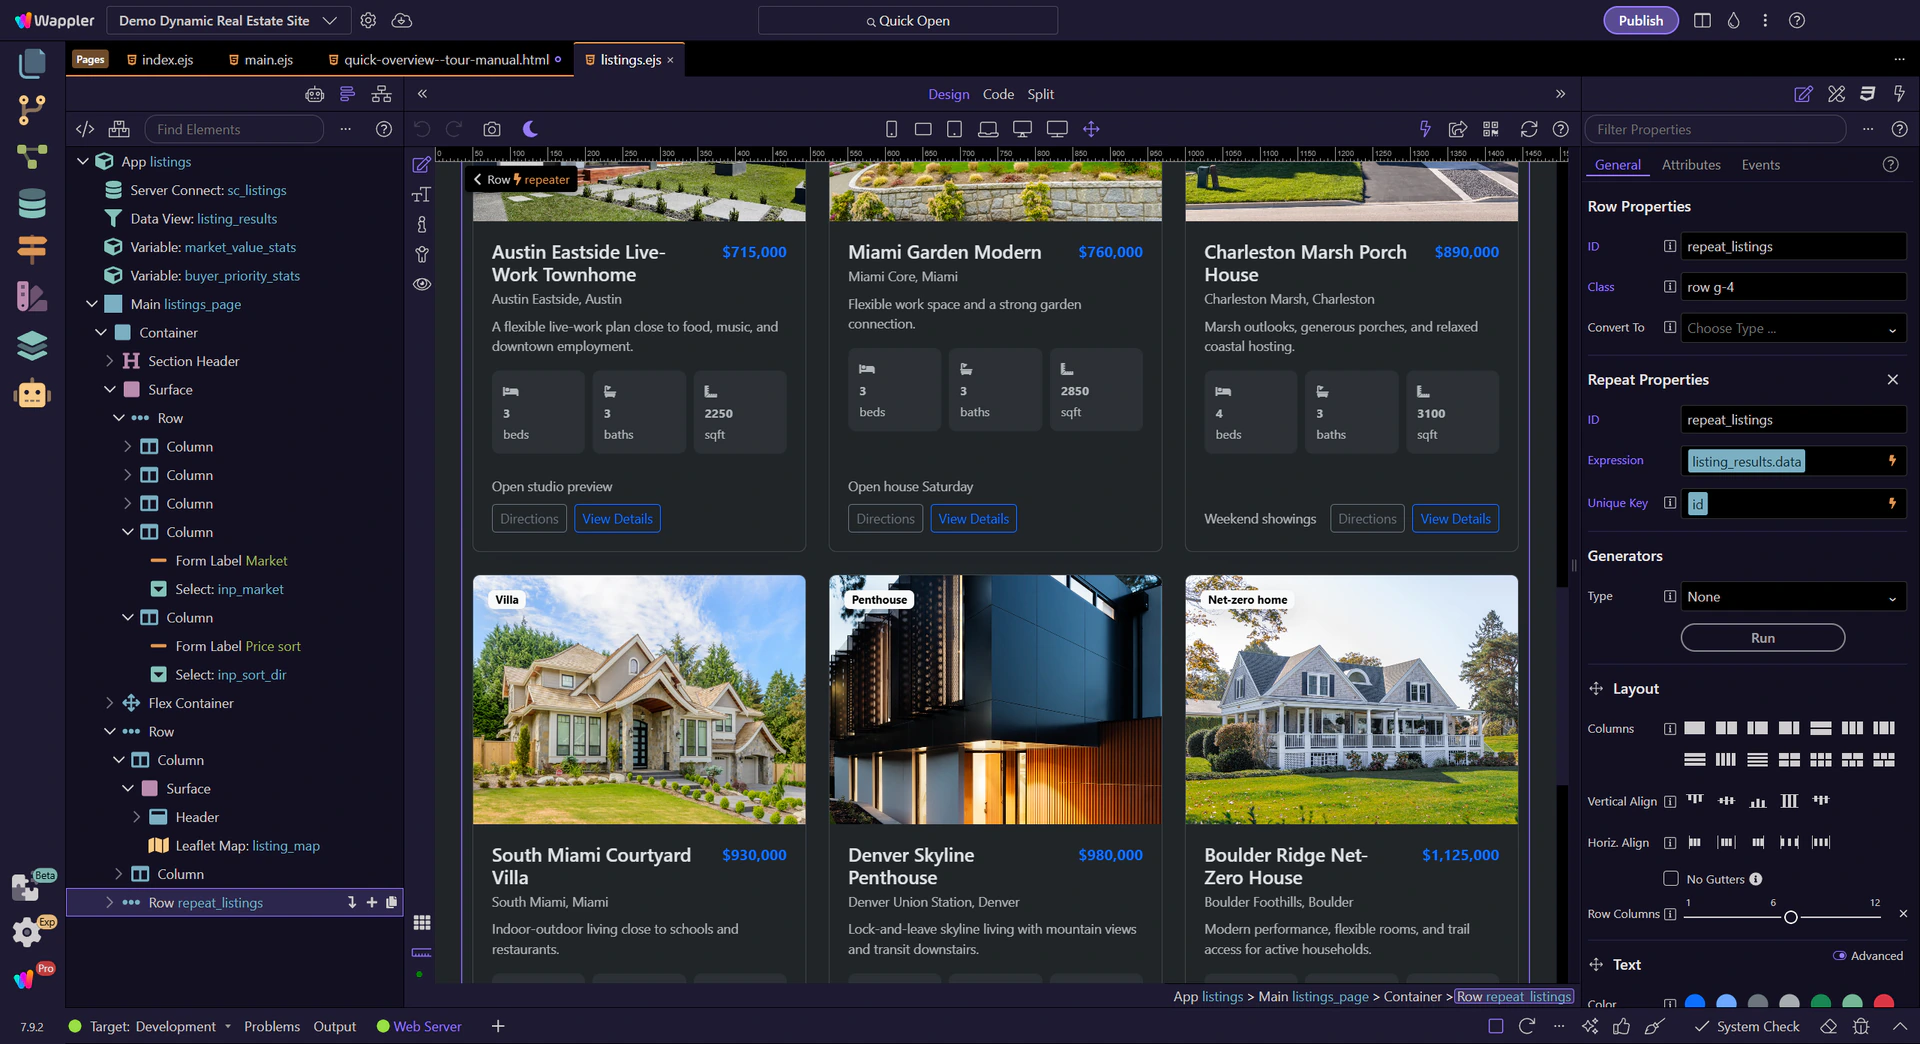
The listings page mixes shaped result outputs with supporting value components and charts, which makes it a strong example of App Connect feeding multiple visual layers at once.
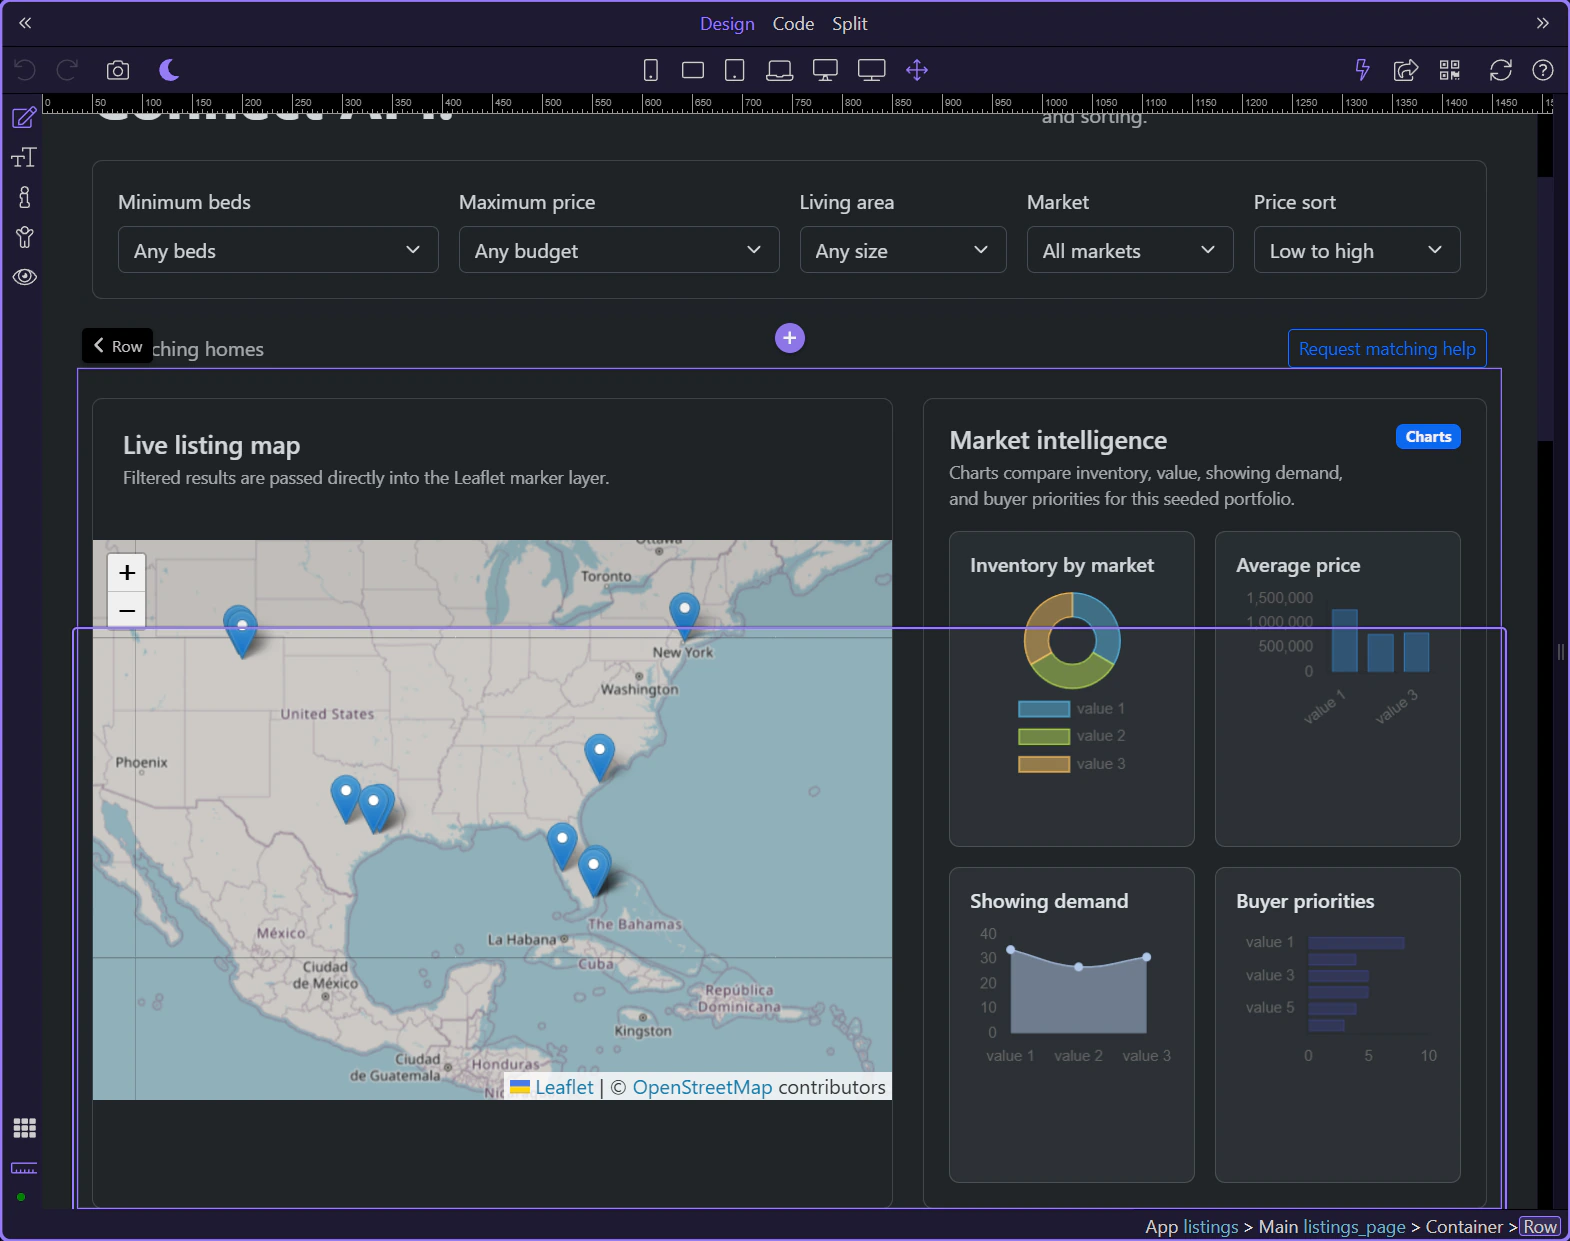
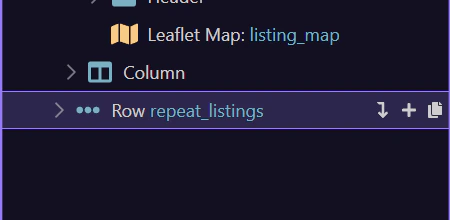
listing_map reads listing_results.data directly, so map markers stay synchronized with the same filtered dataset that drives the visible cards.
repeat_listings is the second consumer of the shaped collection. This is the page’s core lesson: one Data View can drive multiple outputs cleanly.
The listings page turns the renewed demo into a reusable pattern: load once from Server Connect, shape once through Data View, then let several UI outputs consume the same result.
Continue into the detail page, the inquiry form, or the broader App Connect tours from here.