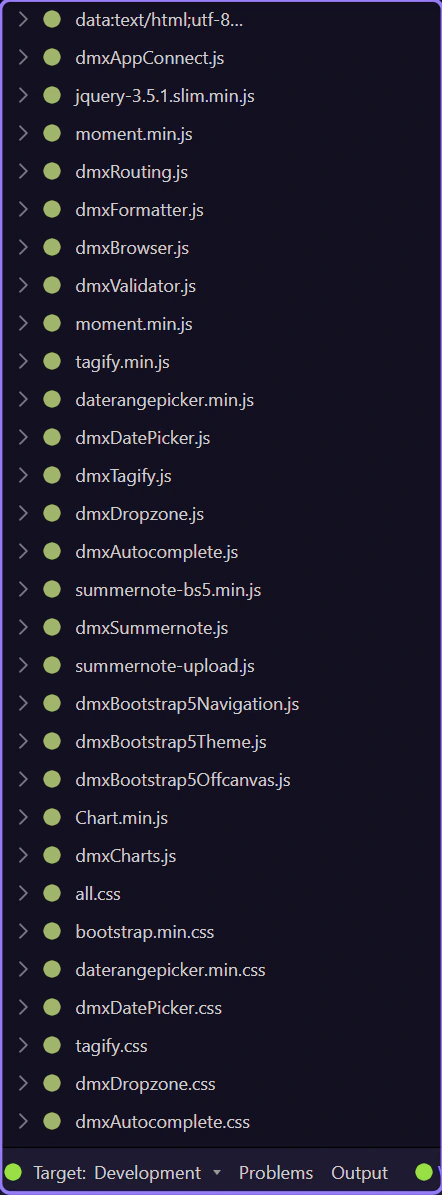
Debug with Network
Learn how to debug with Network in the Page panels. Use this tour as a quick refresher.
Network debugging is easier when you start with the page-level tools that expose request activity in context. This how-to frames the goal before you click anything, then shows how the HTML Editor helps you connect a page action to the network behavior you need to inspect.
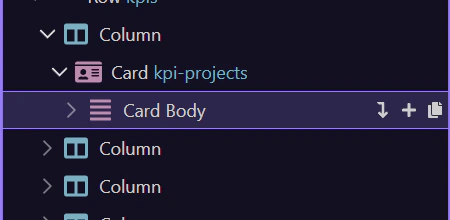
Open Network
Section titled “Open Network”Switch to the Network tab.
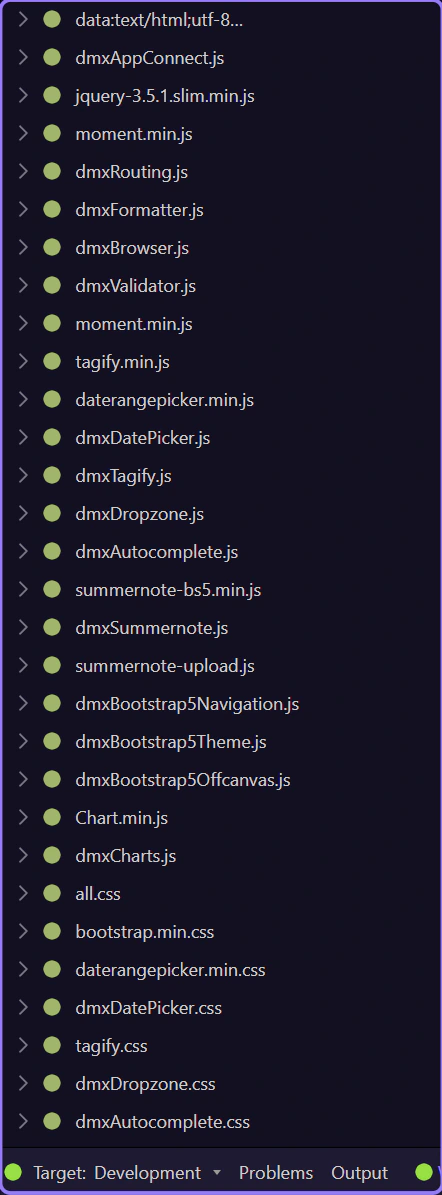
Watch requests
Section titled “Watch requests”Preview the page and look for XHR/fetch and asset requests appearing here.
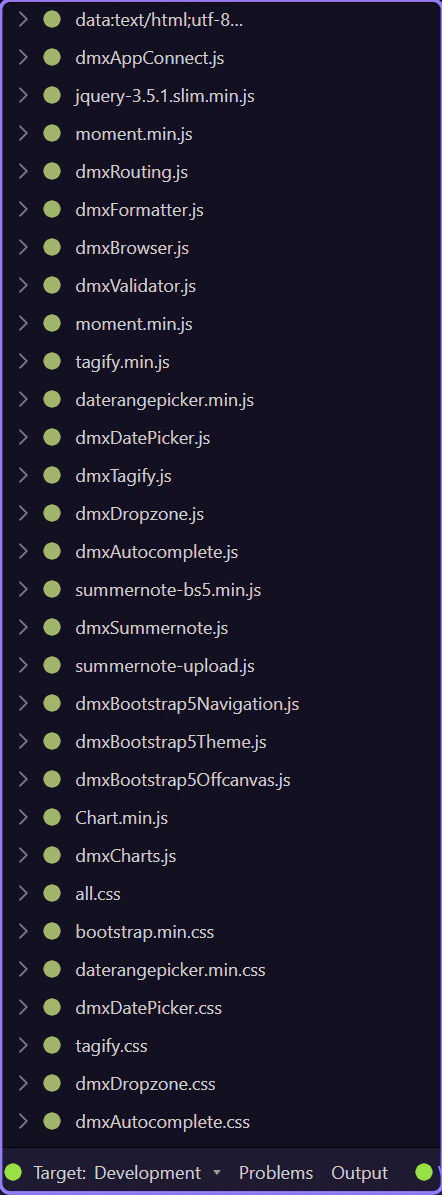
Inspect a request
Section titled “Inspect a request”Select a request to inspect its headers and response.