HTML Editor: Network Panel Reference
Reference tour for the Network panel: request and response inspection, timing details, HTTP diagnostics, and how to debug network activity while building.
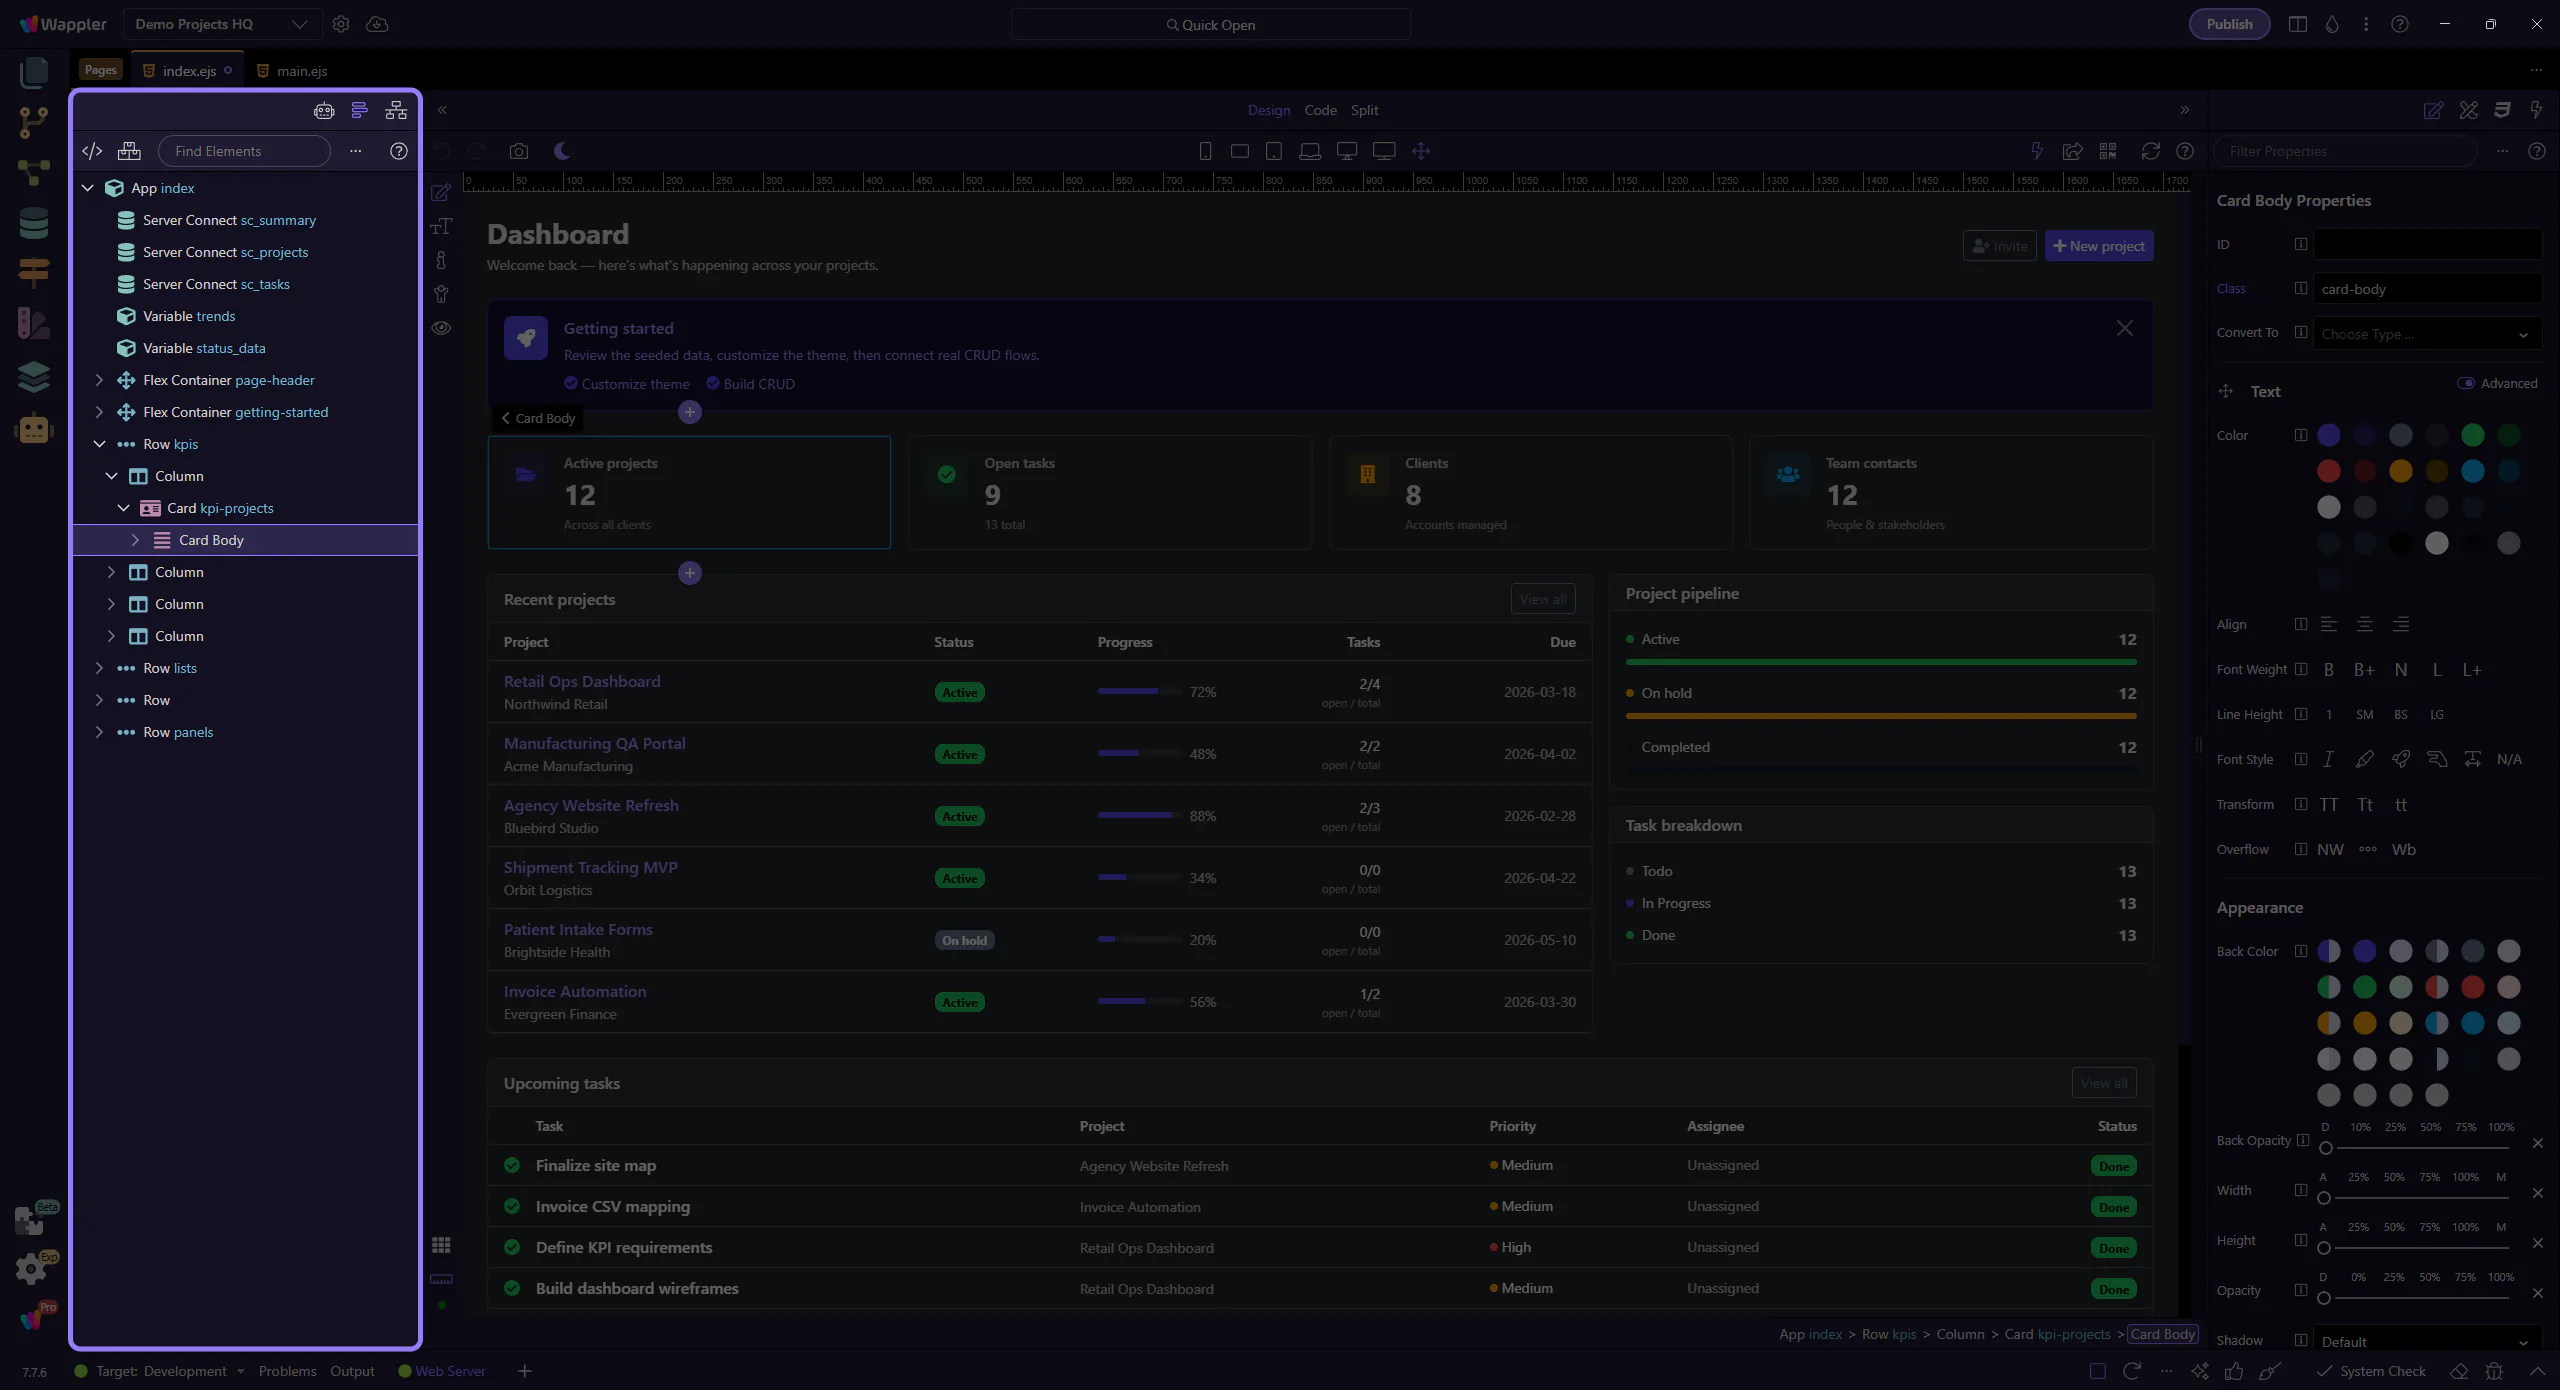
Orient yourself in Page Panels area
Section titled “Orient yourself in Page Panels area”Start with the wider context in the Page Panels area so the next control makes sense in the full workflow. In the next step, you will focus on Toolbar and see how it fits into this area.
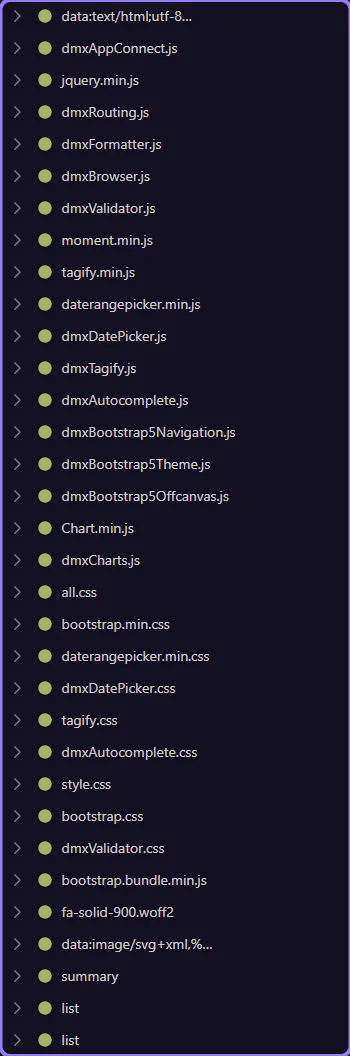
Toolbar
Section titled “Toolbar”Use the toolbar to filter requests, clear the list, and control what you see. This step matters because Toolbar is part of the Network panel, and understanding that context makes the next action easier to repeat in your own project.
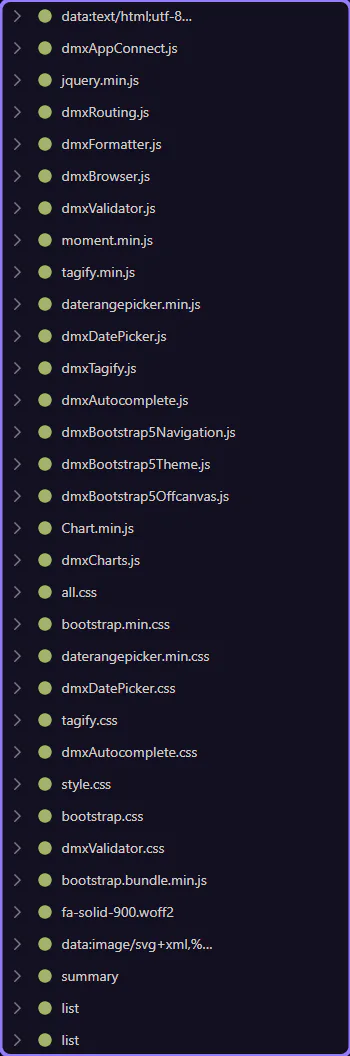
Request context menu
Section titled “Request context menu”Right-click a request to access actions like copying URLs or opening in a new tab. This step matters because Request context menu is part of the Network panel, and understanding that context makes the next action easier to repeat in your own project.
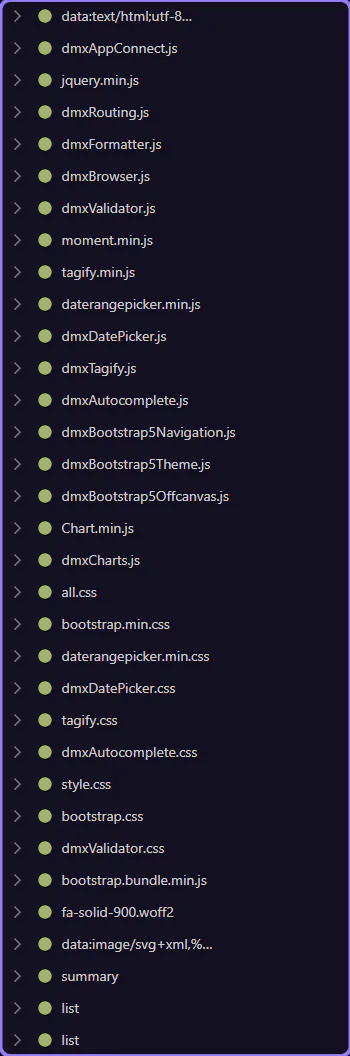
Tree details
Section titled “Tree details”Expand a request node to inspect request/response headers, body, and timing. This step matters because Tree details is part of the Network panel, and understanding that context makes the next action easier to repeat in your own project.