Network & Live Data Panels
Use the HTML Editor’s Network panel and Data panel together to inspect requests, responses, and live bound data while you build.
These two panels answer different debugging questions
The HTML Editor splits network inspection and live data inspection across two panel areas. Use Network when you need to inspect requests and responses, and use the Data panel when you need to inspect the datasets currently bound into the page.
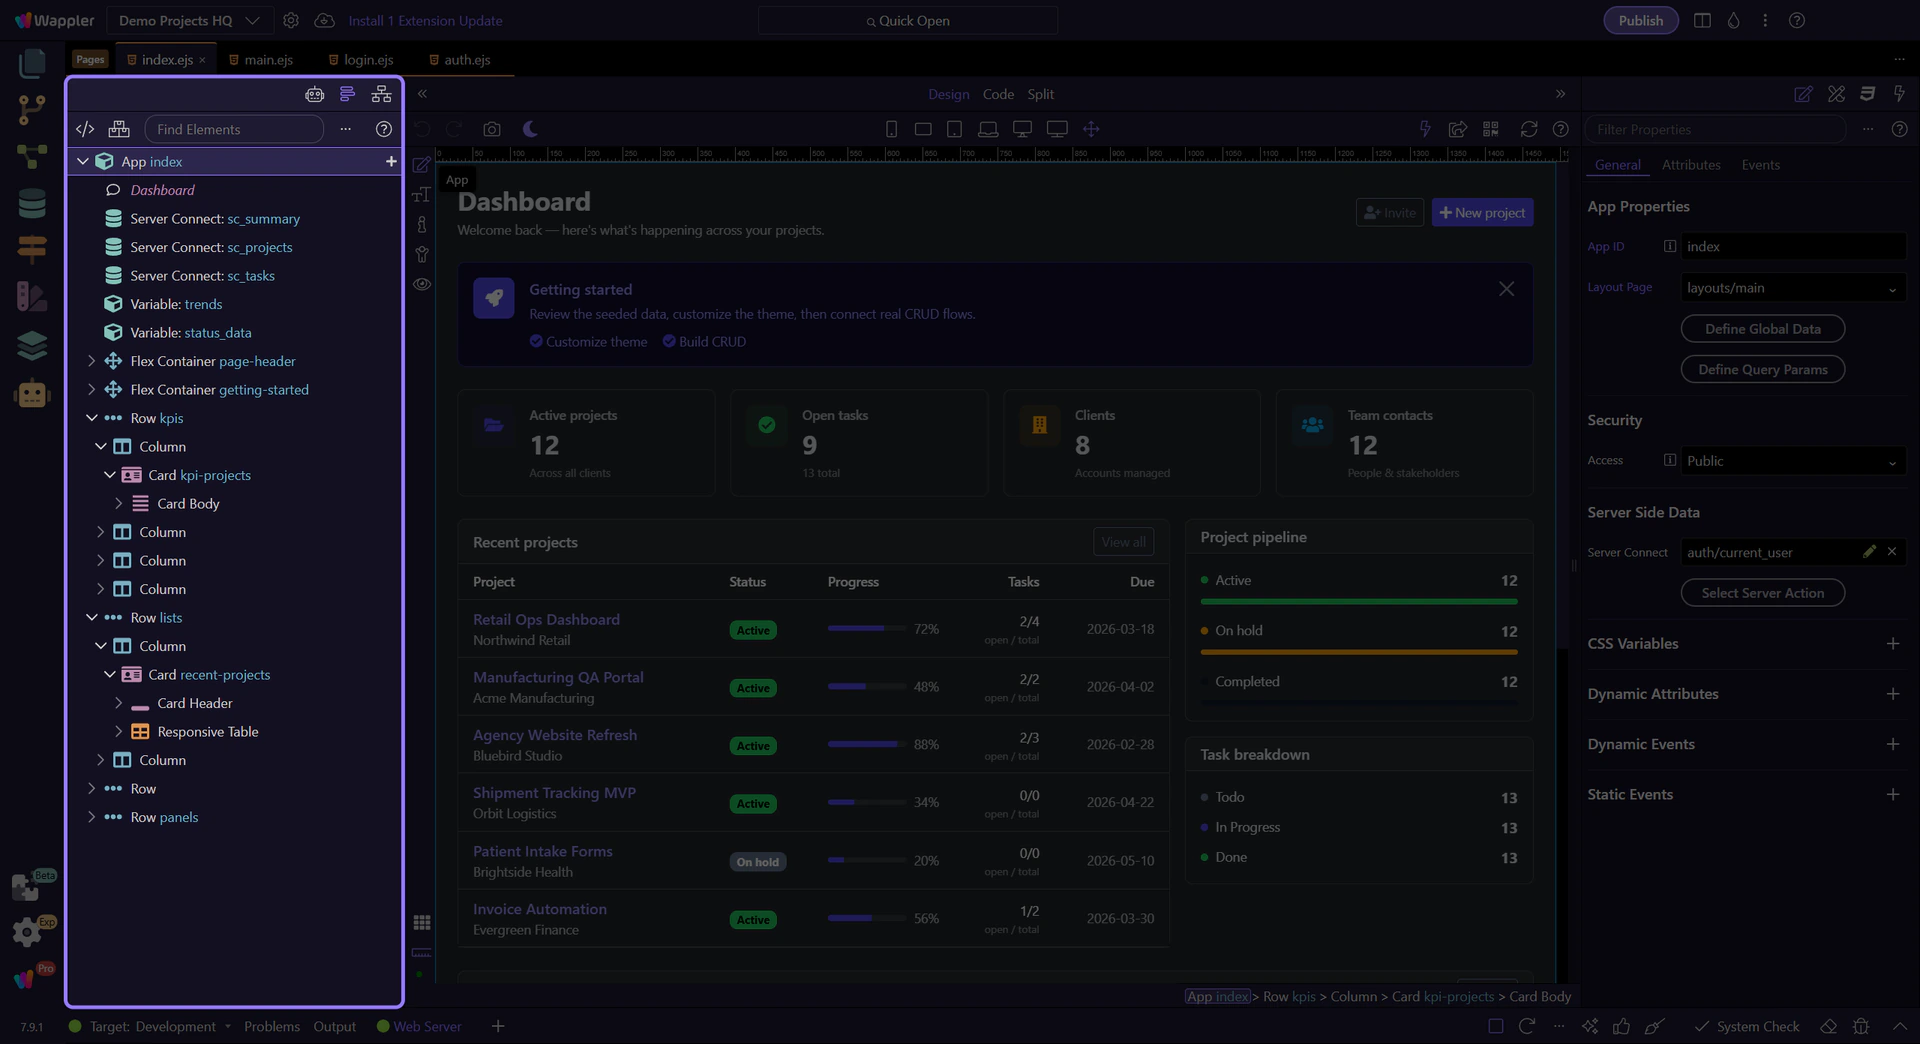
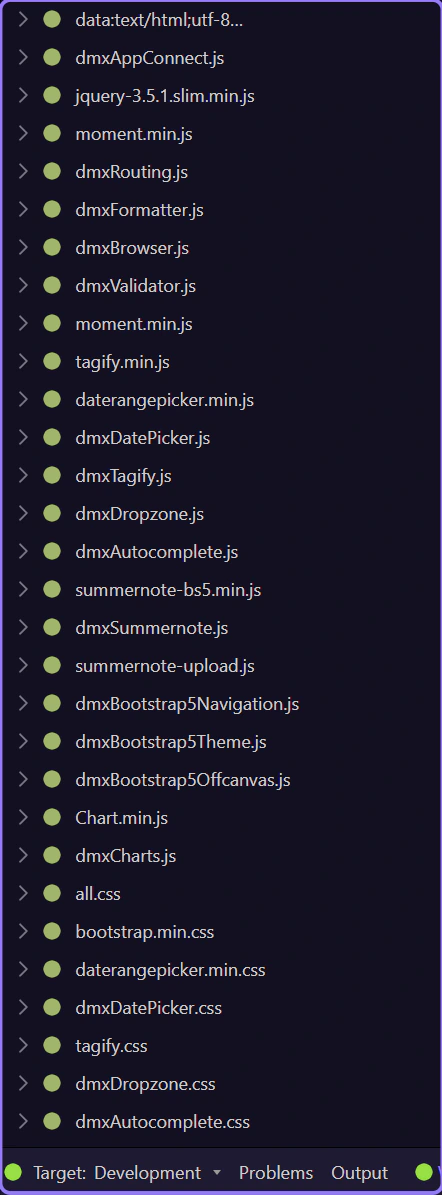
Network is for request and response inspection
The Network panel is the place to inspect what the page is sending and receiving. Use it when you need to confirm an API call fired, inspect the response payload, or check timing and request details.
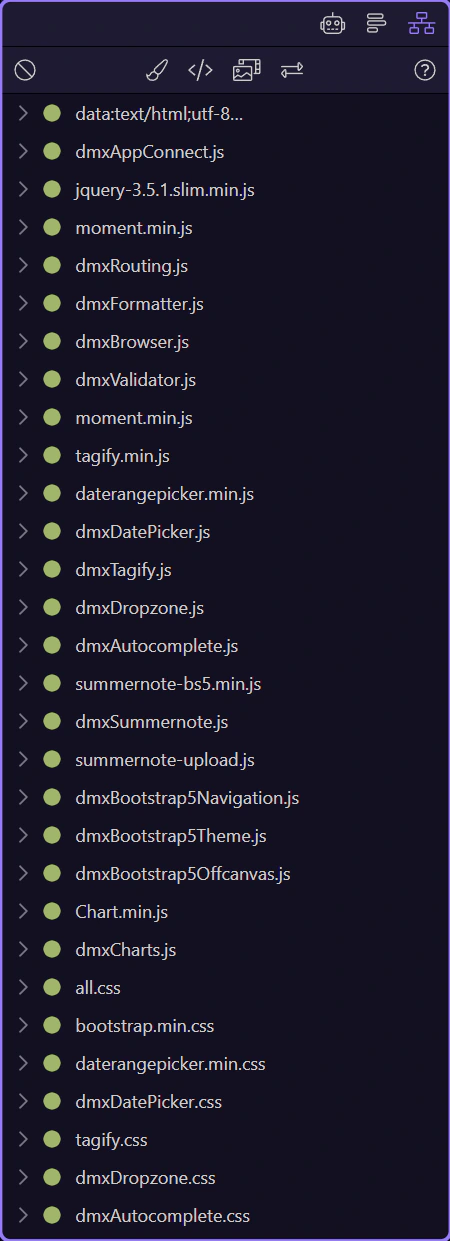
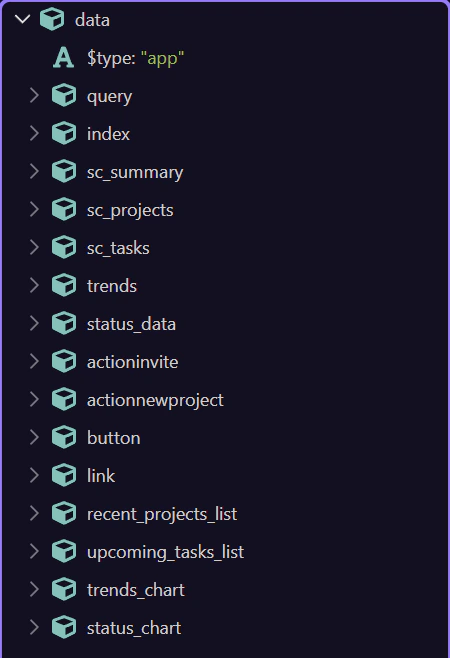
The Data panel shows the page’s live bound data
The Data panel is where you inspect the datasets, sources, and values available to the current selection. Use it when the request already succeeded and you need to understand what data the page is actually holding or binding.
Continue with the dedicated panel tours
This topic mapped the two panel surfaces to the two debugging jobs they solve. Continue with the dedicated Network tour for request/response workflows, or the Data Panel tour for deeper source and value inspection.