Debugging Made Easy: Understanding Web and Database Server Outputs
Intro You can easily explore the web and database server logs in Wappler using its built-in debugging tools. These tools let you view server responses and errors in real time, making it simple to pinp
You can easily explore the web and database server logs in Wappler using its built-in debugging tools. These tools let you view server responses and errors in real time, making it simple to pinpoint and resolve issues.
Web and Database Server Console Panels
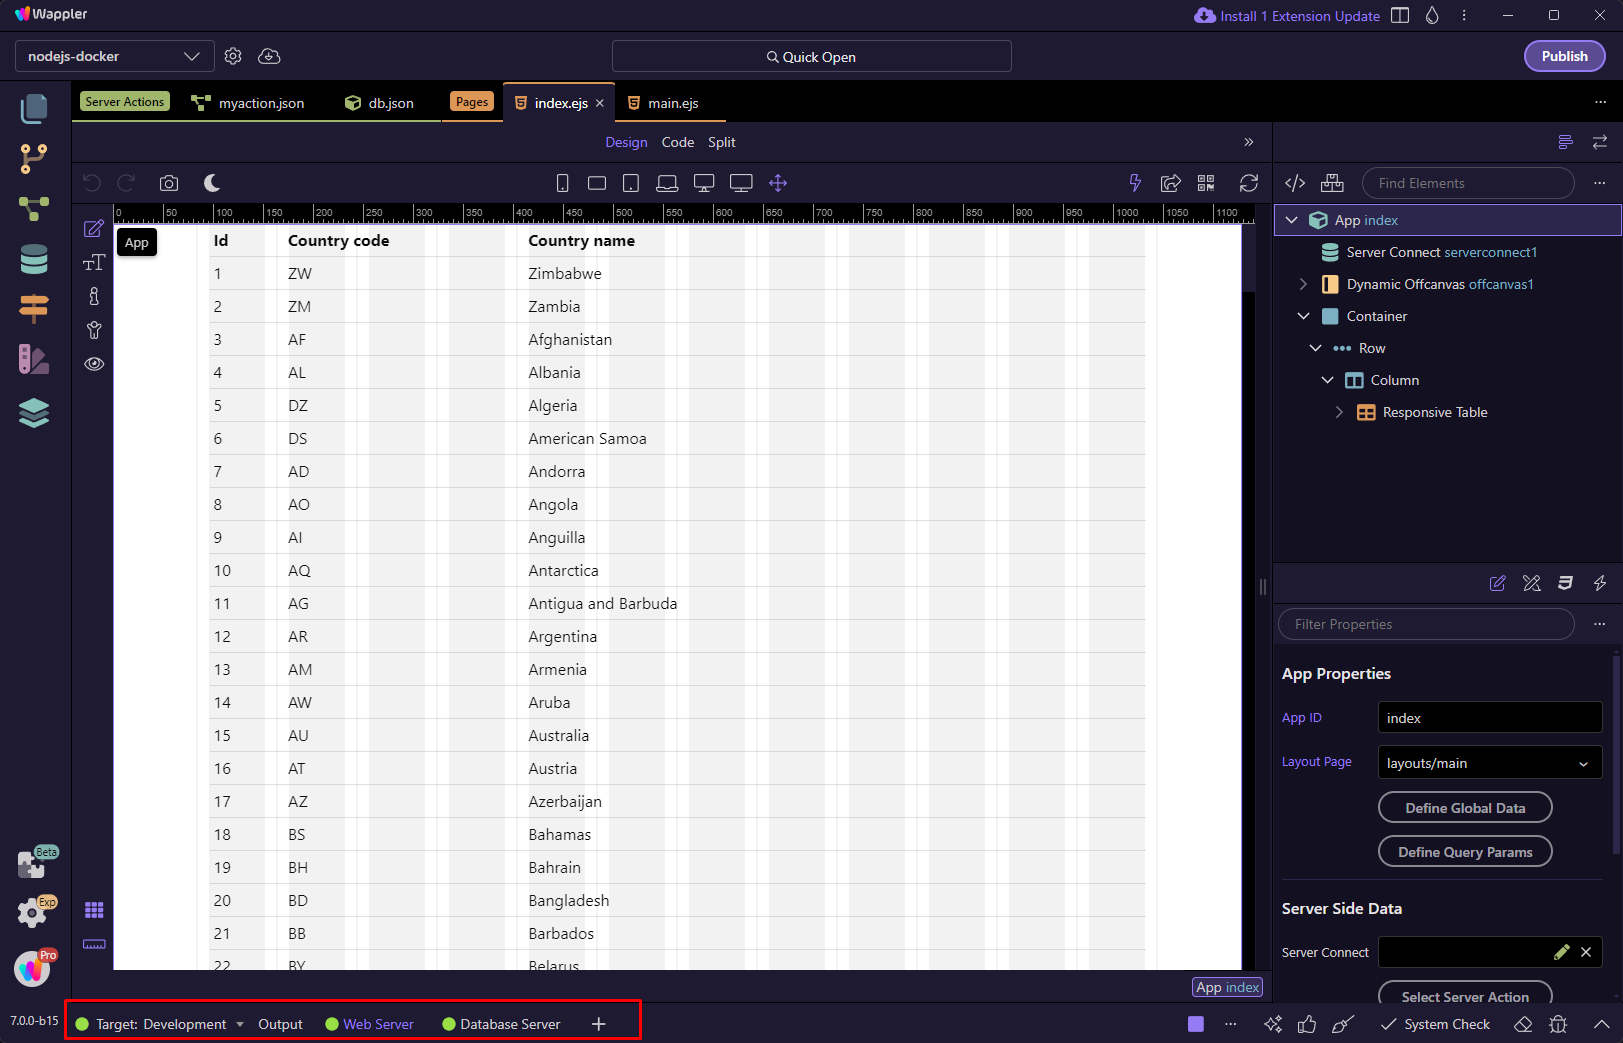
Section titled “Web and Database Server Console Panels”When you start a project you can find the Web and Database Server tabs automatically loaded in the bottom panel when you have a Web and a Database Server defined for your project/target:
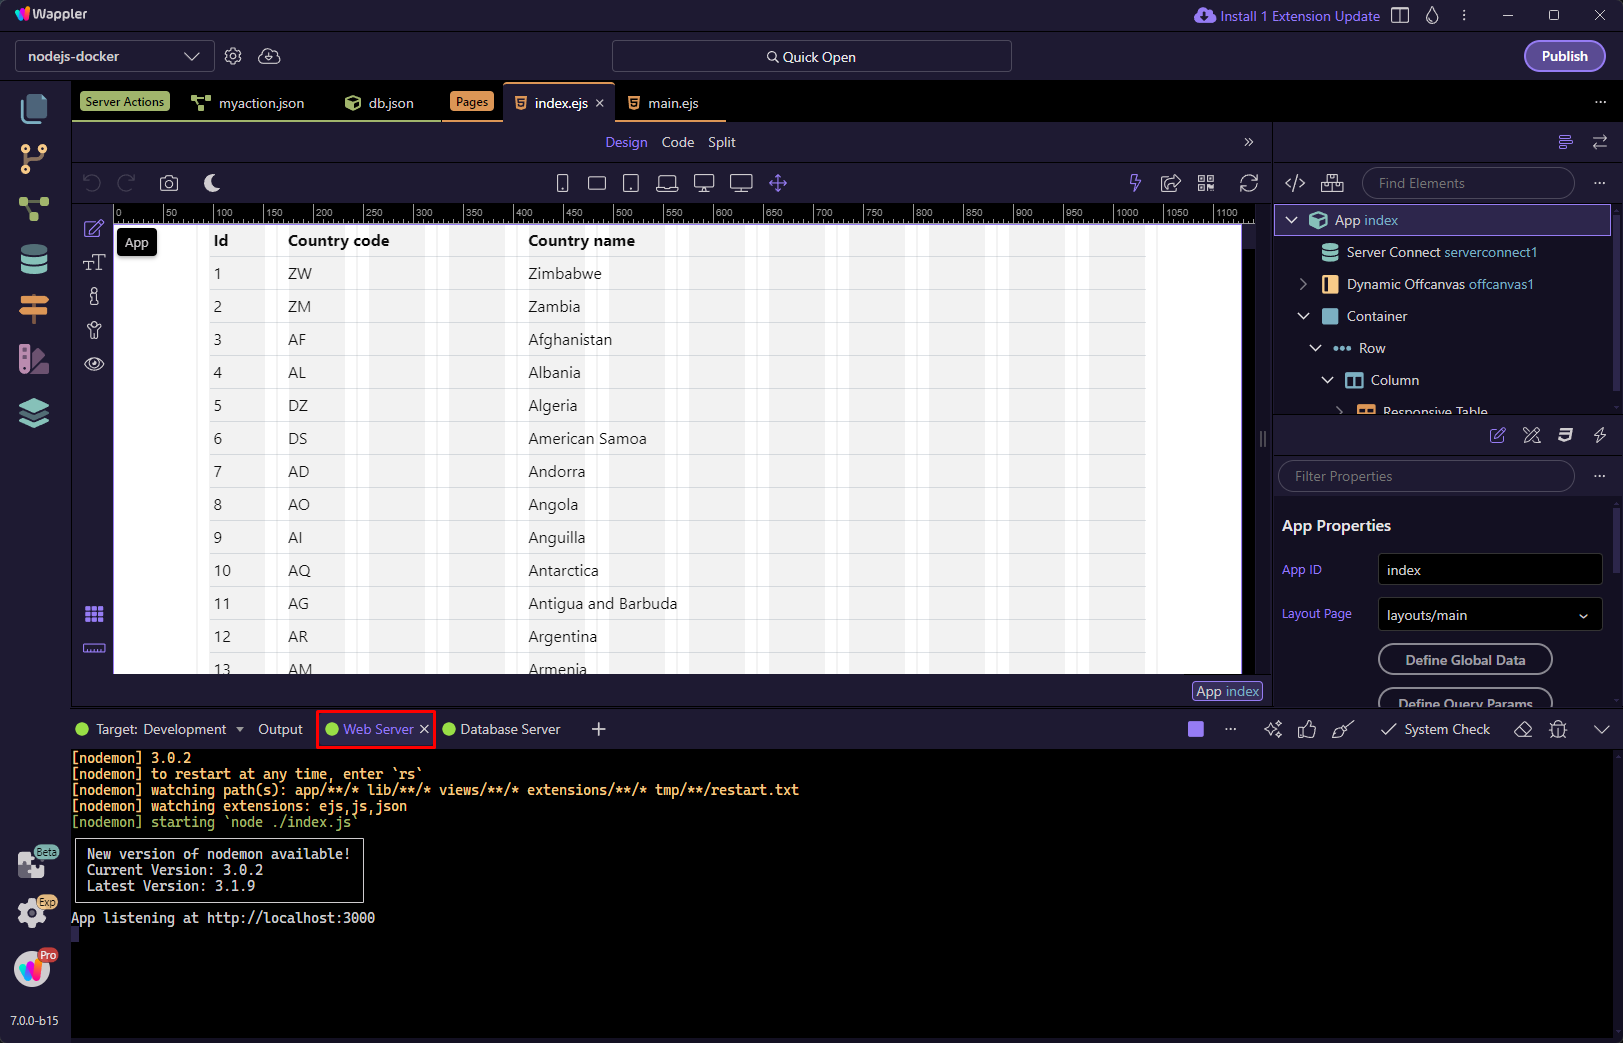
Clicking on any of the tabs you can explore the output. Web Server:
Section titled “Clicking on any of the tabs you can explore the output. Web Server:”Clicking on any of the tabs you can explore the output.
Web Server:
Database Server:
Section titled “Database Server:”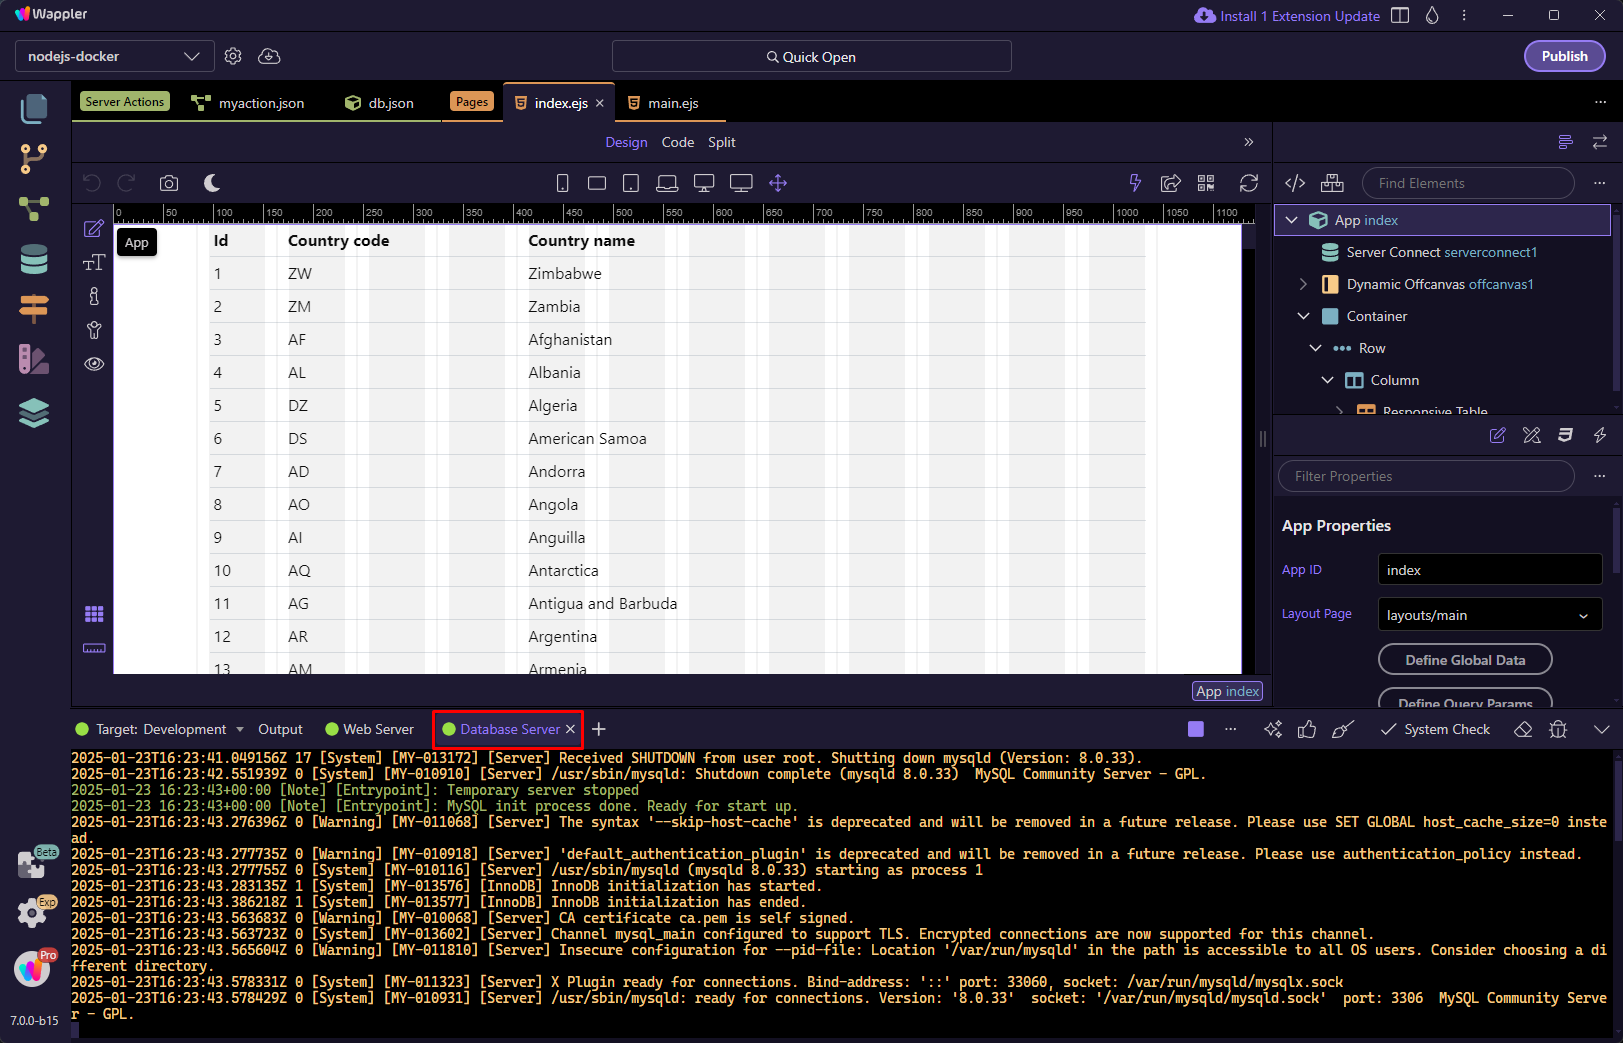
If there are any errors you can see them in the output:
Section titled “If there are any errors you can see them in the output:”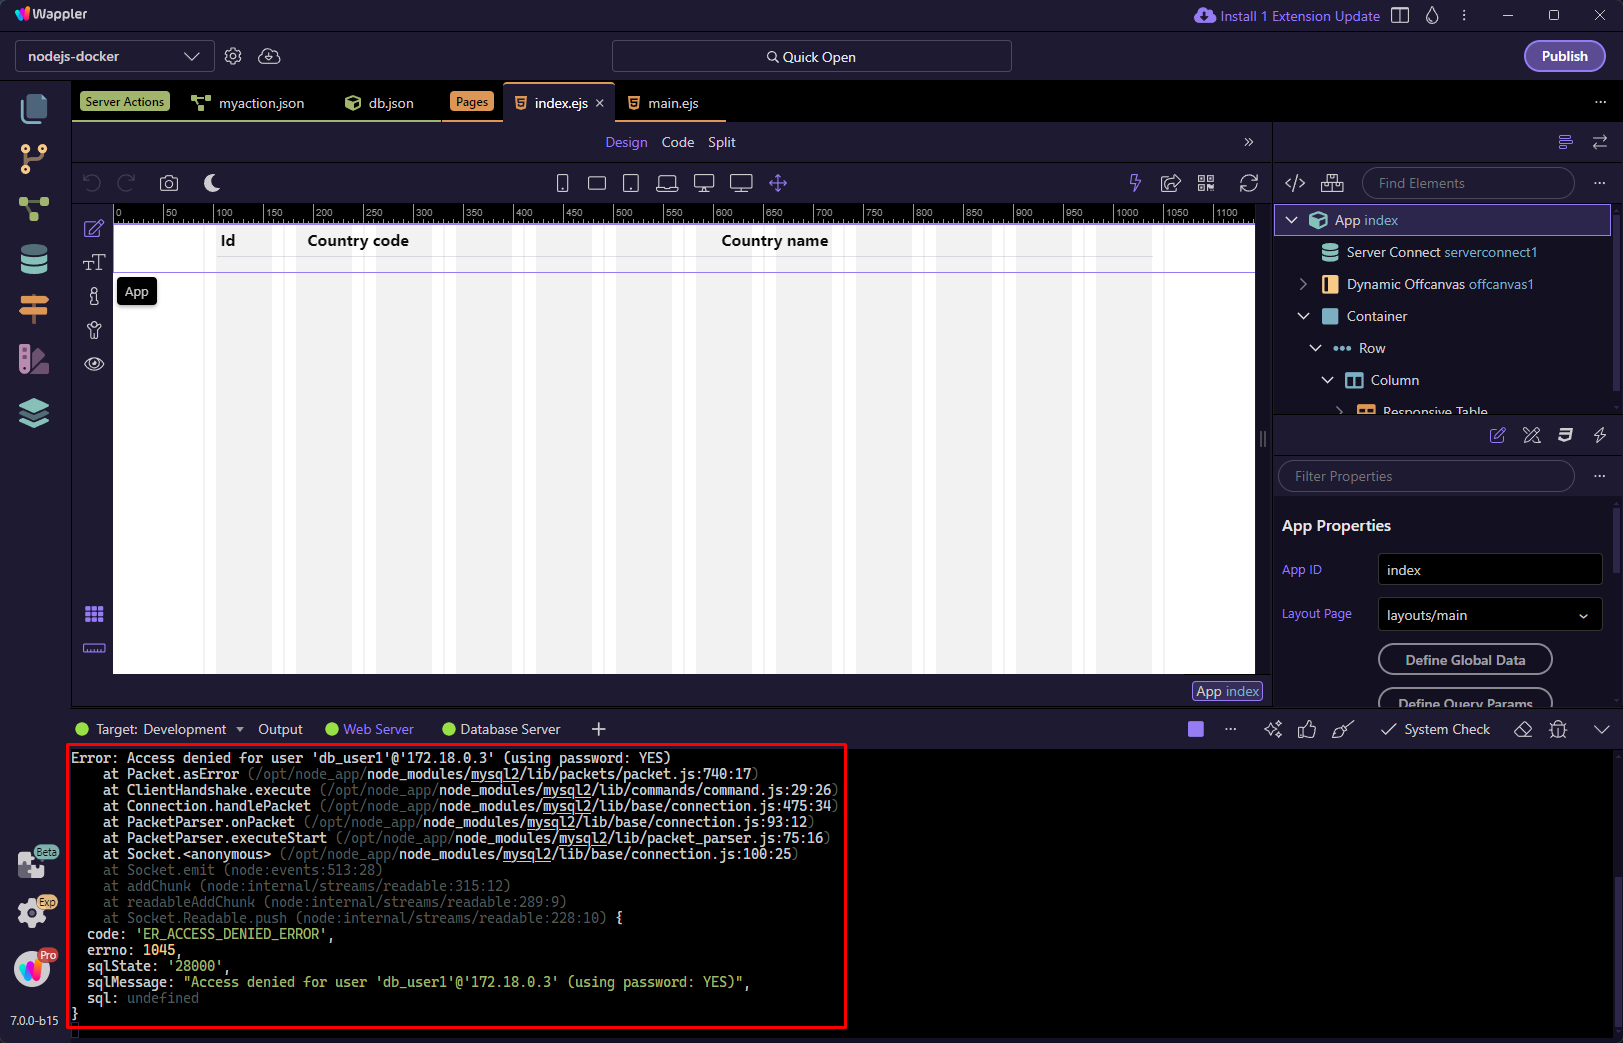
Opening other Console Panels
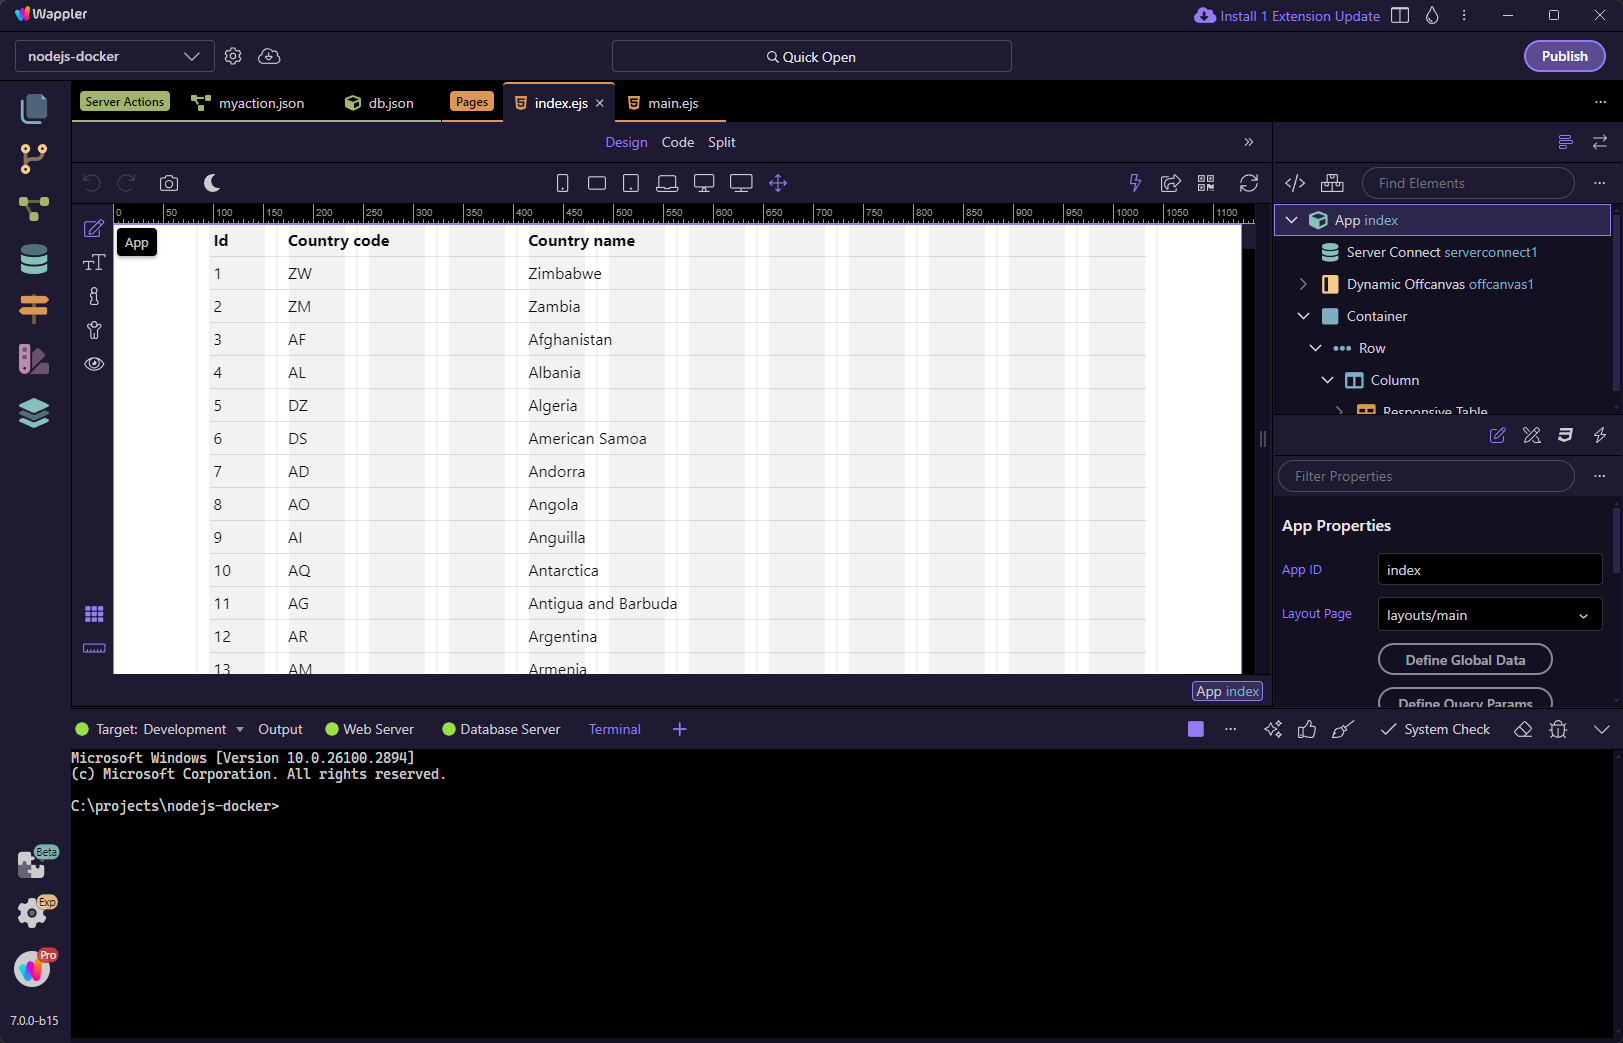
Section titled “Opening other Console Panels”You can open other console panels by clicking the dropdown and selecting a panel to open:
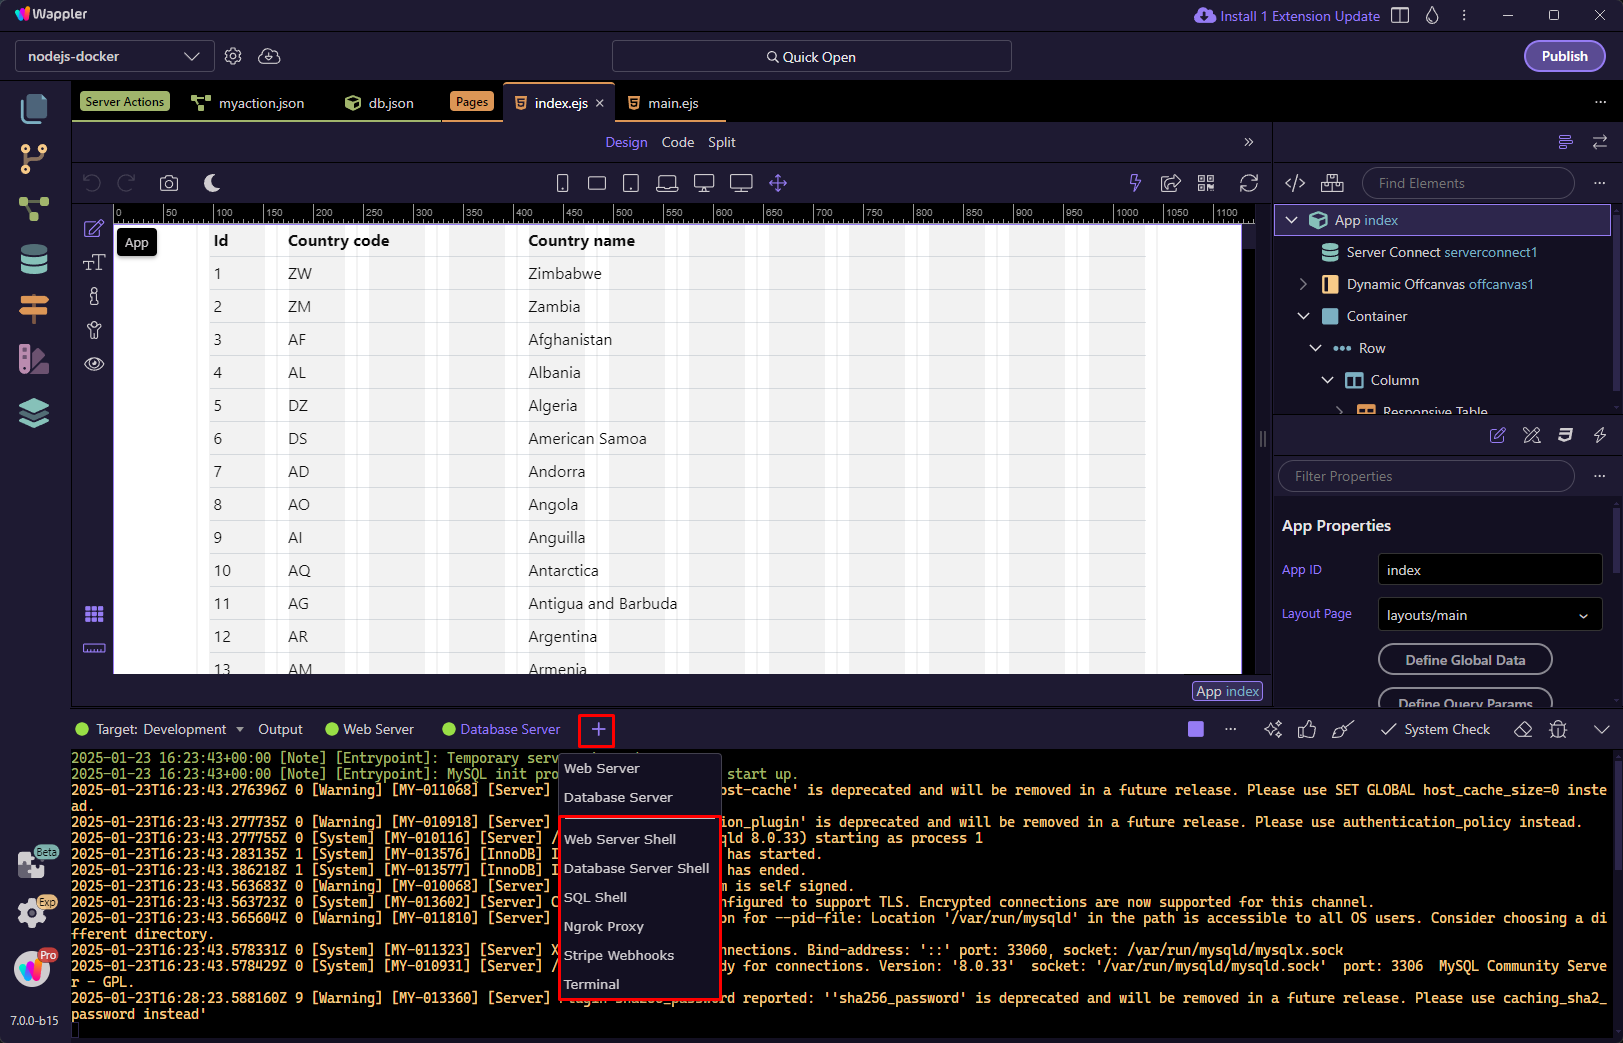
For example you can open the Terminal:
Section titled “For example you can open the Terminal:”